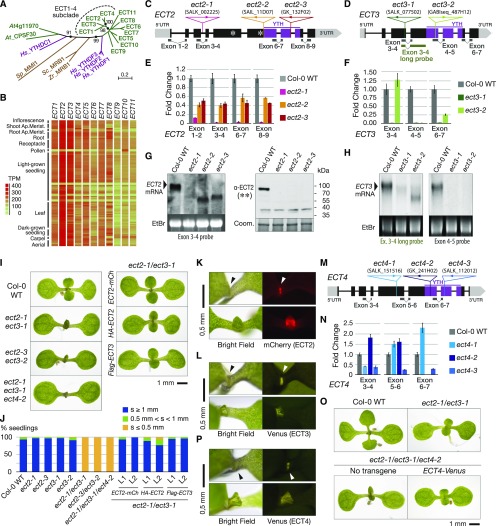
Figure 1.
Timing of Leaf Formation Is Controlled by ECT Proteins.
(A) Phylogenetic relationship of Arabidopsis YTH domain proteins (green). The ECT1-4 subclade is highlighted. Human YTHDFs and YTHDC1 (magenta) and three yeast YTH domain proteins (brown) are included as a reference. Hs, Homo sapiens; Zr, Zygosaccharomyces rouxii; Sc, Saccharomyces cerevisiae; Sp, Schizosaccharomyces pombe. The percentage of replicate trees in which the associated taxa clustered together in the bootstrap test (1000 replicates) is shown next to the nodes (marked with black circles) that are relevant for this study. The length of the branches represents the evolutionary distance in number of amino acid substitutions per site.
(B) RNA-seq expression map of ECT genes extracted from ARAPORT (Cheng et al., 2017). Shading is a log2 scale of transcripts per million (TPM).
(C) and (D) Schematic representation of the ECT2 (C) and ECT3 (D) loci and their associated T-DNA insertion lines. Exons are depicted as boxes and introns as lines. Amplicons and probes used for qPCR and RNA gel blot are represented under the gene diagrams. Asterisks on ECT2 indicate the position of the peptides used to raise the antibody used in (G).
(E) and (F) qPCR analysis of ECT2 (E) and ECT3 (F) expression levels in T-DNA insertion alleles, using the amplicons shown in (C) and (D), respectively. Error bars represent the se in three technical replicates.
(G) RNA (left panel) and protein (right panel) blots of total RNA or protein purified from inflorescences of the indicated genotypes. Ethidium bromide (EtBr) and Coomassie blue (Coom.) staining are used as RNA and protein loading controls, respectively. The positions of the probe and the epitopes (**) are shown in (C).
(H) RNA gel blots of total RNA purified from seedlings of the indicated genotypes. Ethidium bromide (EtBr) staining is used as a loading control. Probes refer to (D).
(I) Eight-day-old seedlings of Col-0 wild type, ect2/ect3 double mutants with or without ECT2-mCherry, 3xHA-ECT2, or FLAG-ECT3 transgenes, and the triple mutant ect2-1/ect3-1/ect4-2.
(J) Quantification of the length of the first true leaves at 8 d after germination in the indicated genotypes. Only seedlings with cotyledons of at least 2.5 mm were considered. Between 50 and 100 seedlings were analyzed in all cases, and two independent stable lines (L1 and L2) were analyzed for each transgene. s, size of first true leaves.
(K) Fluorescence microscopy of ECT2-mCherry in ect2-1 ECT2-mCherry seedlings at 4 (upper panel) and 6 (lower panel) d after germination.
(L) Same as in (K) for Venus fluorescence in 4-d-old (upper panel) and 5-d-old (lower panel) ect3-2 ECT3-Venus seedlings. In (K) and (L), arrowheads point to fluorescence detected at sites of leaf formation.
(M) Schematic representation of the ECT4 locus and its associated T-DNA insertion lines, using the same symbols as in (C) and (D).
(N) qPCR analysis of ECT4 expression levels in seedlings of ect4 T-DNA insertion alleles, using the amplicons shown in (M). Error bars represent the se in three technical replicates.
(O) Ten-day-old seedlings of Col-0 wild type, ect2-1/ect3-1, and ect2-1/ect3-1/ect4-2 mutants with or without ECT4-Venus.
(P) Fluorescence microscopy of ECT4-Venus in 4-d-old (upper panel) and 8-d-old (lower panel) ect2-1/ect3-1/ect4-2 ECT4-Venus seedlings. Arrowheads denote detection of fluorescence at the shoot apex and emerging leaves as in (K) and (L).

