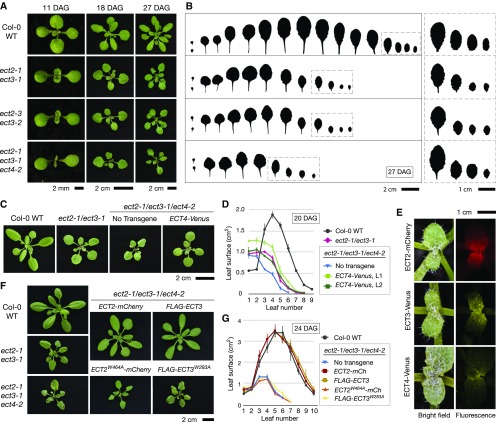
Figure 3.
Leaf Morphogenesis Requires ECT2, ECT3, and ECT4.
(A) Seedlings and young rosettes of the indicated genotypes at three different time points. All plants were germinated directly on soil. DAG, days after germination.
(B) Leaf profiles of the plants in (A) at 27 DAG. Note the abnormal shape and delayed development in ect2-1/ect3-1, ect2-3/ect3-2, and ect2-1/ect3-1/ect4-2. The four younger leaves of all plants are magnified on the right side (dashed squares) to show the different margins.
(C) and (D) Partial restoration of ect2-1/ect3-1/ect4-2 rosette phenotypes (20 DAG) by expression of transgenic ECT4-Venus, as indicated by overall rosette phenotype (C) or measured by average leaf surface areas (D). T2 plants of two independent transgenic lines (L1 and L2) are analyzed. Dots indicate the average area of every type of leaf among three to five plants grown in parallel. Lines connect dots to facilitate reading. Error bars indicate se.
(E) Fluorescence microscopy of the second pair of true leaves of plants expressing ECT2-mCherry, ECT3-Venus, or ECT4-Venus as indicated.
(F) and (G) Complementation of ect2-1/ect3-1/ect4-2 rosette phenotypes (24 DAG) by expression of transgenic ECT2-mCherry or FLAG-ECT3, but not of their corresponding m6A binding site mutants. Data were obtained and represented as in (C) and (D), except that the plants are older and averages of transgenic lines are calculated from independent T1 plants.

