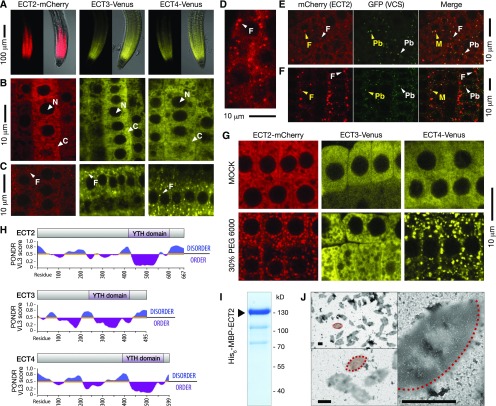
Figure 5.
ECT2, ECT3, and ECT4 Are Cytoplasmic and May Aggregate in Granules.
(A) Confocal images of mCherry or Venus fluorescence in root tips grown inside MS-agar of ect2-1 ECT2-mCherry, ect3-2 ECT3-Venus, and ect2-1/ect3-1/ect4-2 ECT4-Venus. Left panels display only fluorescence, and right panels show an overlay of fluorescence over bright field images.
(B) and (C) Fluorescence of root tips of the plants described in (A) at higher magnification. N, nucleus; C, cytoplasm; F, foci.
(D) Confocal image of ECT2-mCherry-expressing roots grown on the agar surface.
(E) and (F) Confocal images of mCherry and GFP fluorescence in root tips grown inside MS-agar of plants coexpressing VCS-GFP and ECT2-mCherry. Unstressed roots (E) and roots stressed (F) by partial dehydration in 0.8% noble agar for 10 h. Arrowheads point to different kinds of cytoplasmic bodies: F, ECT2-mCherry Foci; Pb, P-body; M, merge. Yellow coloring indicates rare colocalization.
(G) Confocal images of root tips of the plants described in (A) after treatment with 30% PEG6000 in MS, or mock treatment (MS), for 1 h.
(H) Intrinsic disorder prediction of ECT2/3/4 by PONDR-VL3 (Predictor of Naturally Disordered Regions-VL3) scores (Peng et al., 2005). PONDR-VL3 values increase with the predicted increase in disorder.
(I) Coomassie-stained SDS-PAGE gel of Ni2+-NTA-affinity purified His6-MBP-ECT2.
(J) Negative stain transmission electron microscopy of His6-MBP-ECT2 shown in (I). Examples of eye-shaped electron dense assemblages are outlined and shaded in red (only half-outlined at the highest magnification). Bars = 1 μm.

