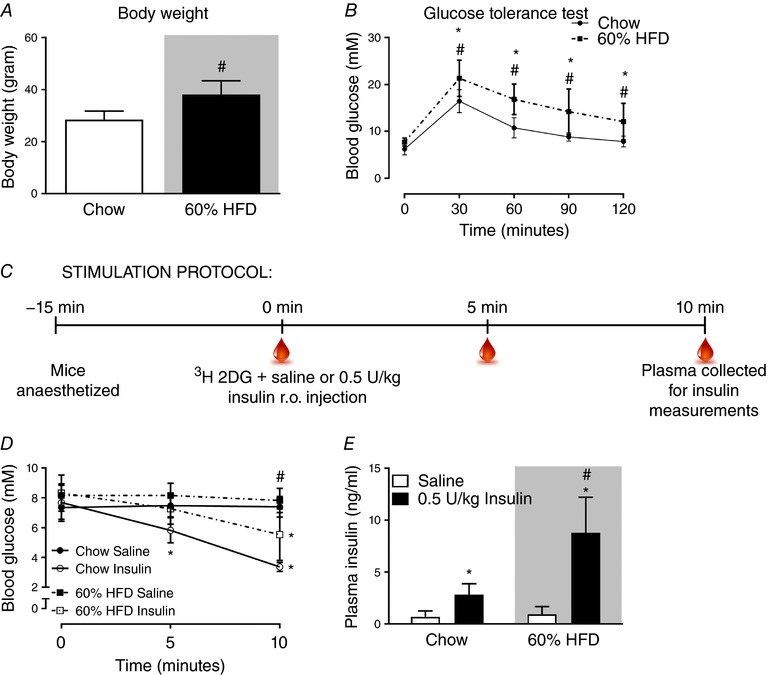
Figure 1. HFD‐fed C57BL/6J mice have lower insulin clearance compared to chow fed mice.

A, body weight of C57BL/6J mice fed either standard chow diet or 60% high‐fat diet (HFD) for 18 weeks. n = 15–16. B, glucose tolerance test at week 17 into the diet intervention; blood glucose following intraperitoneal injection of glucose (2 g kg−1 body weight). n = 15–16. C, stimulation protocol for in vivo analysis of plasma insulin following retro‐orbital (r.o.) insulin injection (0.5 U kg−1). D, blood glucose prior to and following 5 and 10 min r.o. saline or insulin injection. n = 7. E, plasma insulin concentration in r.o. saline‐ or insulin‐injected groups. n = 7. Shaded areas indicate HFD. Significant effect of glucose/insulin stimulation is indicated by * (P < 0.001). Significant effect of diet is indicated by # (P < 0.001). Unpaired t test (A) and 2‐way ANOVAs (repeated measurements for B and D) were performed for statistical analysis. Values are means ± SD. [Color figure can be viewed at http://wileyonlinelibrary.com]
