
Figure 4. Loss of Rac1 in skeletal muscle exacerbates muscle insulin resistance on a high‐fat diet but improves insulin‐stimulated glucose uptake in adipose tissue.
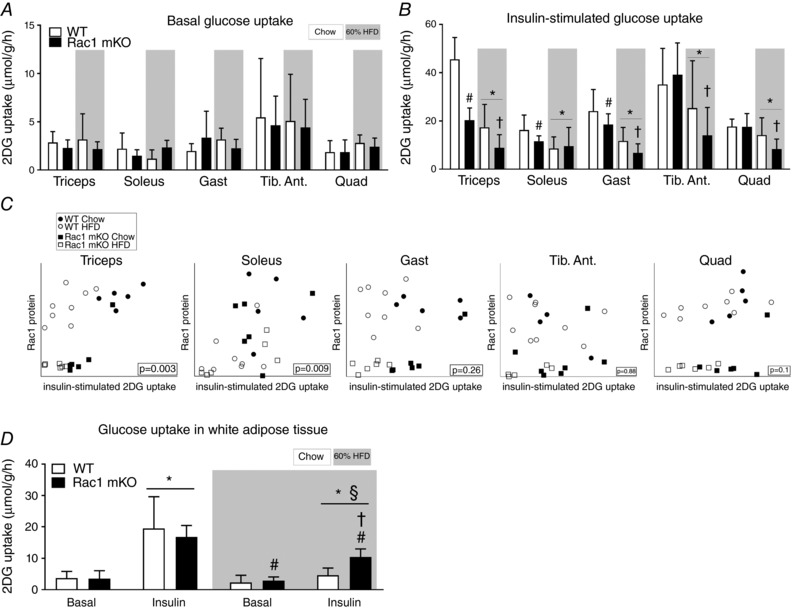
A, basal (saline‐stimulated) 2‐deoxy‐glucose (2DG) uptake in wild type (WT) and muscle‐specific Rac1 knockout (mKO) triceps, soleus, gastrocnemius (Gast), tibialis anterior (Tib. Ant.) and quadriceps (Quad) muscle on chow or 60% high‐fat diet (HFD) at week 18. n = 5–8. B, insulin‐stimulated (insulin dose of 0.5 U kg−1 for chow‐fed mice, 0.3 U kg−1 for high‐fat‐fed mice, 10 min) 2DG uptake. n = 5–8. Significant effect of diet is indicated by * (P < 0.001). Significant effect of Rac1 mKO is indicated by # (P < 0.05). Effect of Rac1 mKO within diet is indicated by † (P < 0.05). C, correlations between muscle Rac1 protein content and insulin‐stimulated glucose uptake in individual muscles. D, basal and insulin‐stimulated 2DG uptake in white adipose tissue following chow diet or HFD in WT or Rac1 mKO mice. Significant effect of insulin is indicated by * (P < 0.001). Significant effect of Rac1 mKO is indicated by # (P < 0.01). Shaded areas indicate HFD. Significant effect of diet within stimulation is indicated by § (P < 0.001). Interaction between genotype and stimulation within diet is indicated by † (P < 0.01). For A and B, several two‐way ANOVAs were performed to test for effects of (i) diet, (ii) insulin, (iii) genotype. Furthermore, two‐way repeated measures ANOVAs including all muscle types from each mouse were performed to test for main effects of diet and genotype. Values are means ± SD.