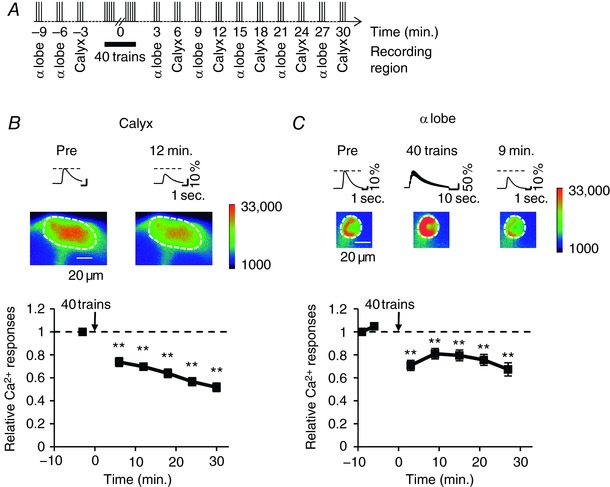
Figure 4. Repetitive AL stimulation induces the reduction of Ca2+ responses in the MB calyx.

A, schematic diagrams of AL stimulation protocol. AL stimulation was applied sequentially every 3 min before and after repetitive AL stimulation with 40 trains. Ca2+ responses were recorded in the α lobe and calyx in the same brain. B and C, +; MB247 UAS‐GCaMP3/+ males were used in the experiments. Asterisks indicate the statistical significance of the difference between before and after the application of 40 stimulus trains. The Mann–Whitney U test was used for statistical analysis. Error bars represent SEM. ** P < 0.01; n = 7. B, Ca2+ responses in the calyx after repetitive AL stimulation. The upper panel shows typical Ca2+ responses in the calyx 3 min before (Pre) and 12 min after the application of 40 stimulus trains. Pseudo‐color represents the intensity of GCaMP3 fluorescence. The area enclosed by a dashed circle is the calyx. C, Ca2+ responses in the α lobe after repetitive AL stimulation in the same brain shown in B. The upper panel shows typical Ca2+ responses in the α lobe 6 min before (Pre), during and 9 min after the application of 40 stimulus trains. The area enclosed by dashed lines is the α lobe. [Color figure can be viewed at http://wileyonlinelibrary.com]
