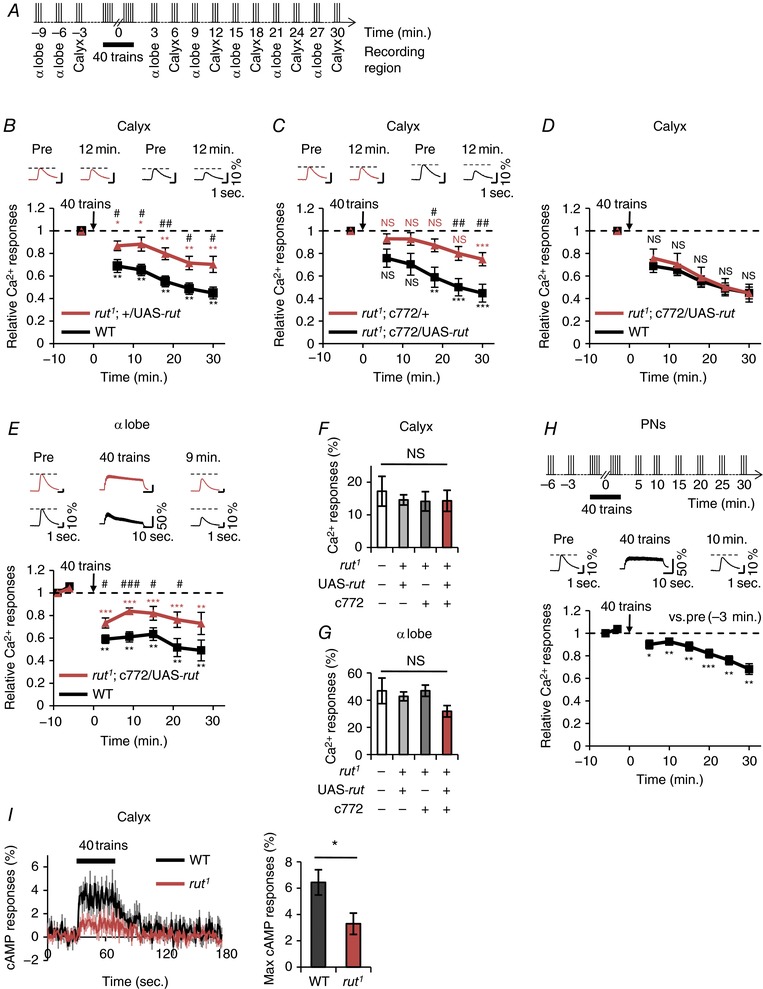
Figure 5. rut expression in MB neurons is required for the reduction of Ca2+ responses in the MB calyx.

A, schematic diagram of AL stimulation protocol. B and C, the upper panels show typical Ca2+ responses in the calyx 3 min before (Pre) and 12 min after the application of 40 stimulus trains. E, the upper panels show typical Ca2+ responses in the α lobe 6 min before (Pre), during and 9 min after the application of 40 stimulus trains. B, C and E, asterisks indicate the statistical significance of the difference between before and after the application of 40 stimulus trains. The Mann–Whitney U test was used for statistical analysis. Error bars represent SEM. NS, not significant; * P < 0.05; ** P < 0.01; *** P < 0.001. B, relative Ca2+ responses in the calyx of wild‐type (black line; +; +; MB‐LexA LexAop‐GCaMP6m/+; n = 7) and rut1 (red line; rut1; +/UAS‐rut; MB‐LexA LexAop‐GCaMP6m/+; n = 7). Hash symbols indicate the statistical significance of difference at each time point between two genotypes. Student's t test or the Mann–Whitney U test was used for statistical analysis.# P < 0.05; ## P < 0.01. C, relative Ca2+ responses in the calyx of rut1; c772/UAS‐rut; MB‐LexA LexAop‐GCaMP6m/+ (black line; n = 9) and rut1; c772/+; MB‐LexA LexAop‐GCaMP6m/+ (red line; n = 9). Hash symbols indicate the statistical significance of difference at each time point between two genotypes. Student's t test was used for statistical analysis. # P < 0.05; ## P < 0.01. D, no significant difference was detected at each time point between the wild‐type (black line; +; +; MB‐LexA LexAop‐GCaMP6m/+) and rut1; c772/UAS‐rut (red line; rut1; c772/UAS‐rut; MB‐LexA LexAop‐GCaMP6m/+) in the calyx. The results for the wild‐type are the same as those shown in B, and the results for rut1; c772/UAS‐rut are the same as those shown in C. The Mann–Whitney U test was used for statistical analysis. Error bars represent SEM. NS, not significant. E, in the α lobe, the degree of reduction of Ca2+ responses in rut1; c772/UAS‐rut (red line; rut1; c772/UAS‐rut; MB‐LexA LexAop‐GCaMP6m/+) was lower than that in the wild‐type (black line; +; +; MB‐LexA LexAop‐GCaMP6m/+). Hash symbols indicate the statistical significance of difference at each time point between two genotypes. Student's t test was used for statistical analysis. Error bars represent SEM. # P < 0.05; ### P < 0.001. F and G, Ca2+ responses to AL stimulation with a stimulus train in the calyx (F) and the α lobe (G). +; +; MB‐LexA LexAop‐GCaMP6m/+ (white bar), rut1; +/UAS‐rut; MB‐LexA LexAop‐GCaMP6m/+ (light grey bar), rut1; c772/+; MB‐LexA LexAop‐GCaMP6m/+ (grey bar), and rut1; c772/UAS‐rut; MB‐LexA LexAop‐GCaMP6m/+ (red bar) were used for analysis. One‐way ANOVA or the non‐parametric ANOVA (Kruskal–Wallis test) was used for statistical analysis. Error bars represent SEM. NS, not significant. H, +; GH146 UAS‐GCaMP6m/+; + males were used. Ca2+ responses before and after application of 40 stimulus trains in the terminal of PNs. The upper panel shows a schematic diagram of the stimulation protocol. The middle panel shows typical Ca2+ responses in the terminal of PNs 3 min before (Pre), during and 10 min after the application of 40 stimulus trains. Asterisks indicate the statistical significance of difference at each time point between before and after the application of 40 stimulus trains. Student's t test or the Mann–Whitney U test was used for statistical analysis. Error bars represent SEM. * P < 0.05; ** P < 0.01; *** P < 0.001; n = 6. I, cAMP responses during repetitive AL stimulation in the wild‐type (+; +; 30Y UAS‐Epac1‐camps/+) and rut1 (rut1; +; 30Y UAS‐Epac1‐camps/+). Time course of cAMP responses in the MB calyx (left) and summary of maximum scores from each trace (right). The black line and bar indicate results for the wild‐type (WT; n = 7) and the red line and bar indicate those for rut1 (n = 7). The black rectangle indicates the time of repetitive AL stimulation. Student's t test was used for pairwise comparisons. Error bars represent SEM. * P < 0.05. [Color figure can be viewed at http://wileyonlinelibrary.com]
