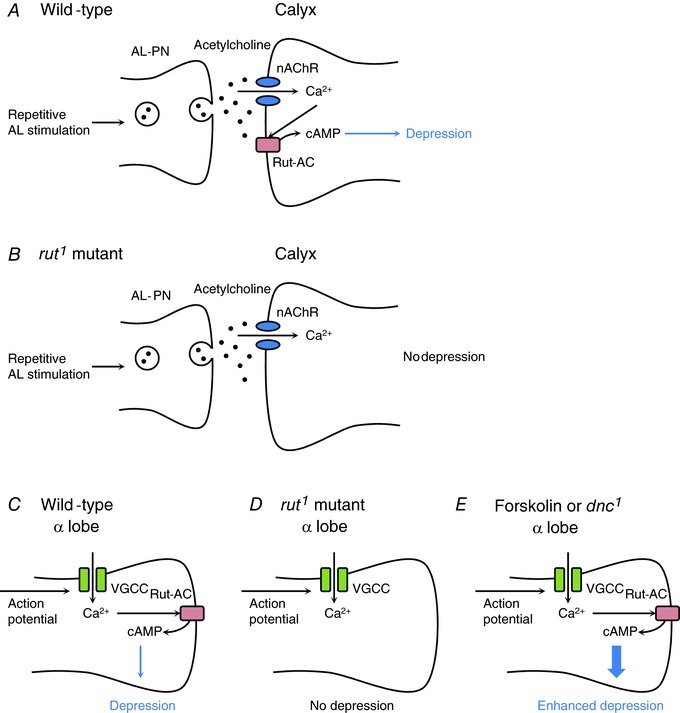
Figure 6. Possible model of the reduction of Ca2+ responses in the MB calyx and α lobe.

A, in the wild‐type, the projection neurons of the antennal lobe (AL‐PN) release acetylcholine (black dots) following repetitive AL stimulation, and nAChRs (blue) are activated in the MB calyx. The increase in [Ca2+]i through nAChRs stimulates Rut‐AC (red), and cAMP is produced. The increase in cAMP level induces synaptic depression in the MB calyx. B, in the rut1 mutant, repetitive AL stimulation induces Ca2+ entry through nAChRs. However, Rut‐AC‐dependent cAMP production does not occur. Thus, synaptic depression also does not occur. C, in the wild‐type, action potentials generated by repetitive AL stimulation may induce Ca2+ influx through voltage‐gated calcium channels (VGCCs; green) in the α lobe. The increase in [Ca2+]i activates Rut‐AC, and cAMP is produced. The increase in cAMP level induces the reduction of Ca2+ responses in the α lobe. D, in the rut1 mutant, repetitive AL stimulation induces Ca2+ influx into the α lobe. However, Rut‐AC‐dependent cAMP production does not occur. Thus, the reduction of Ca2+ responses also does not occur. E, forskolin treatment or dnc1 mutation increases the cAMP level. In this situation, the reduction of Ca2+ responses in the α lobe is promoted. [Color figure can be viewed at http://wileyonlinelibrary.com]
