
Figure 3. Light exposure relative to circadian phase for each participant.
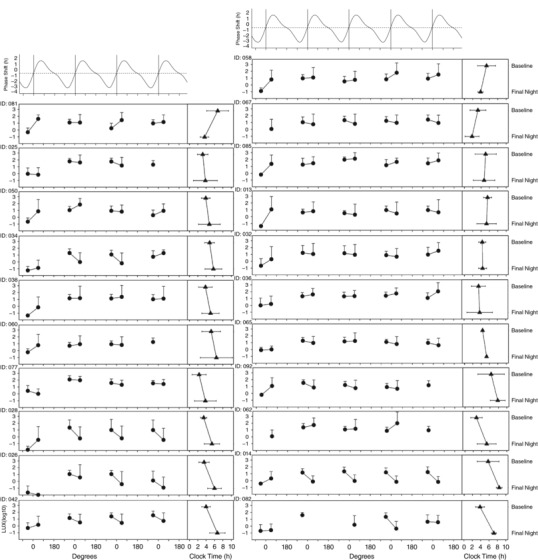
The circles represent log10 lux averaged in each delay (90 degs before acrophase) and advance (90 degs after acrophase) zone at baseline, first night shift (N1), second night shift (N2), third night shift (N3) and fourth night shift (N4). Light is averaged relative to individual circadian phase: the x‐axis represents circadian degrees (360 deg = 24+daily phase shift), such that 0 indicates acrophase each day. Triangles represent aMT6s acrophase in clock time at baseline and final night shift (error bars show 95% confidence intervals). The difference between light in delay compared to advance zones was examined at baseline and each night shift to examine the relationship with the direction of phase shift for each participant.