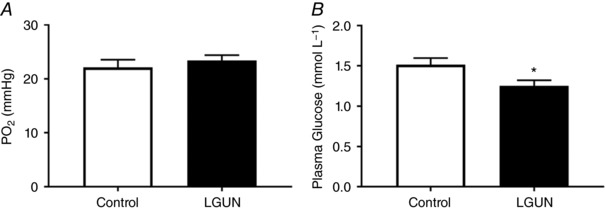
Figure 1. Fetal mean (A) and plasma glucose concentrations (B) across late gestation.

Data are expressed as mean ± SEM and analysed by unpaired t test. Control (n = 6), open bars; LGUN (n = 8), filled bars. * P < 0.05, effect of LGUN. Figure adapted, with permission, from Edwards & McMillen (2001).
