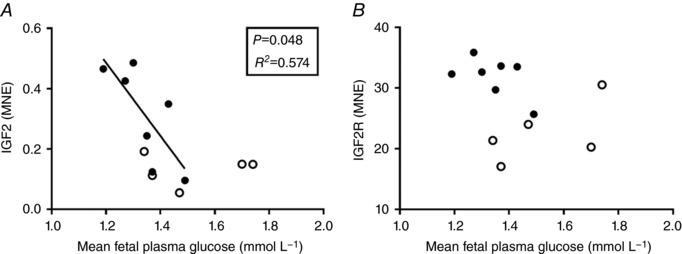
Figure 4. Relationship between mean fetal plasma glucose concentration and the mRNA expression of IGF2 (A) and IGF2R (B).

Each circle represents an individual data point. Control, open circles (n = 5); LGUN, filled circles (n = 7); MNE, mean normalized expression.
