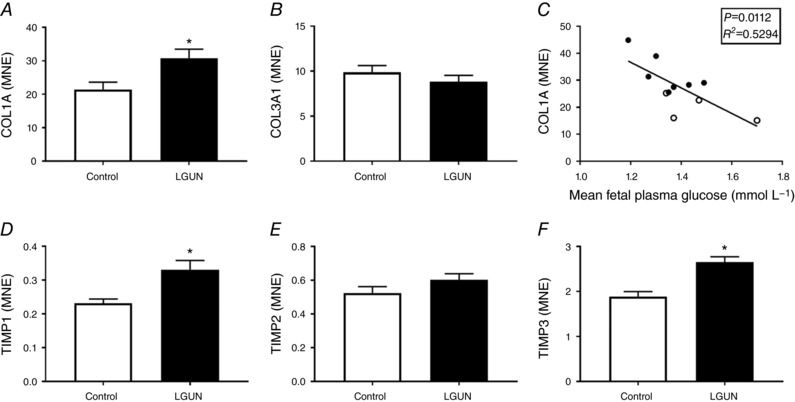
Figure 6. Normalized cardiac mRNA expression of COL1A (A), COL3A1 (B), TIMP‐1(D), TIMP‐2 (E) and TIMP‐3 (F).

Relationship between cardiac COL1A mRNA expression and mean fetal plasma concentrations in late gestation (C). Values are mean ± SEM. Control, open bars/circles (n = 6); LGUN, filled bars/circles (n = 8); MNE, mean normalized expression. *Significantly different from control fetuses (P < 0.05).
