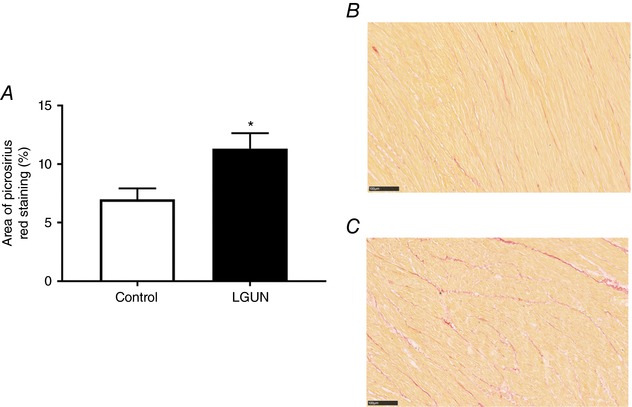
Figure 7. Interstitial collagen deposition (A) determined by picrosirius red staining in Control (B) and LGUN fetuses (C).

Stained slides scanned for whole slide images using a Nanozoomer at 40× magnification. Scale bar on representative images = 100 μm. Data analysed by unpaired t test. Data presented as mean ± SEM. P < 0.05 was considered significant. Control, unfilled bars (n = 4); LGUN, filled bars (n = 4). [Color figure can be viewed at http://wileyonlinelibrary.com]
