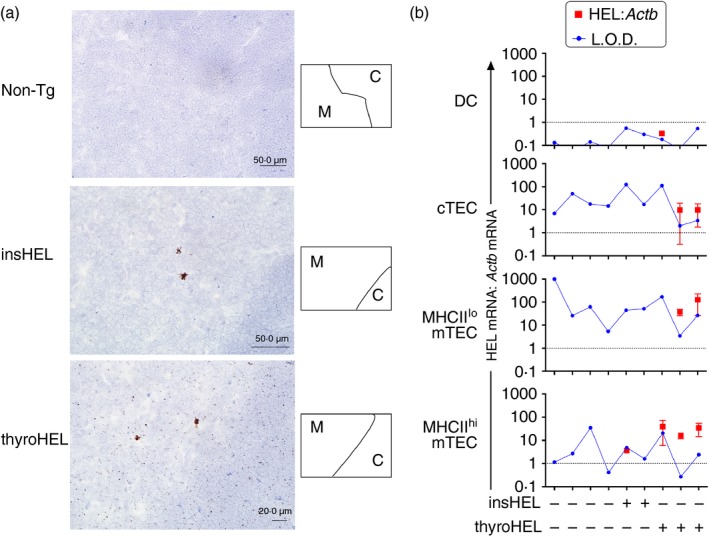
Figure 1.

Differential intrathymic hen egg lysozyme (HEL) expression in mice in which HEL is driven by insulin (insHEL) or thyroglobulin (thyroHEL) promoter. (a) HEL mRNA detection using in situ hybridization in thymic tissue sections from mice of the genotypes indicated (left). Cortical (C) and medullary (M) regions were distinguished based on cell density, as shown in the schematics (right). Sections exposed to the negative control probe targeting the bacterial gene, DapB, were indistinguishable from the non‐transgenic (Non‐Tg) section (data not shown). Sections from thyroHEL mice (n = 3 mice) exhibited low‐intensity punctate staining throughout cortical and medullary regions. (b) Quantification of HEL expression in the thymic antigen‐presenting cell (APC) subsets indicated (left). Dendritic cells (DCs; CD45+ CD11c+), cortical thymic epithelial cells (cTECs; CD45– EpCAM+ UEA‐1– Ly51+), MHCIIlo medullary TECs (mTECs; CD45– EpCAM+ UEA‐1+ MHCII–) and MHCIIhi mTECs (CD45– EpCAM+ UEA‐1+ MHCII+) were sorted from individual thymi of mice of the indicated genotypes (bottom) and cDNA was analysed by real‐time PCR. For samples in which a product was detected in the HEL‐specific PCR, red symbols on graphs show HEL expression relative to the internal control gene, Actb, calculated using the comparative C T method. Values were normalized to HEL expression levels in the insHEL testis, which is represented by the dotted line at 1 on the y‐axis. Limits of detection (L.O.D.) were determined based on the maximum C T value for the lowest concentration of insHEL testis cDNA that generated a product in nine out of nine HEL‐specific PCRs. Error bars show the standard deviation of observations from three independent experiments performed on the same panel of cDNA samples.
