Figure 3.

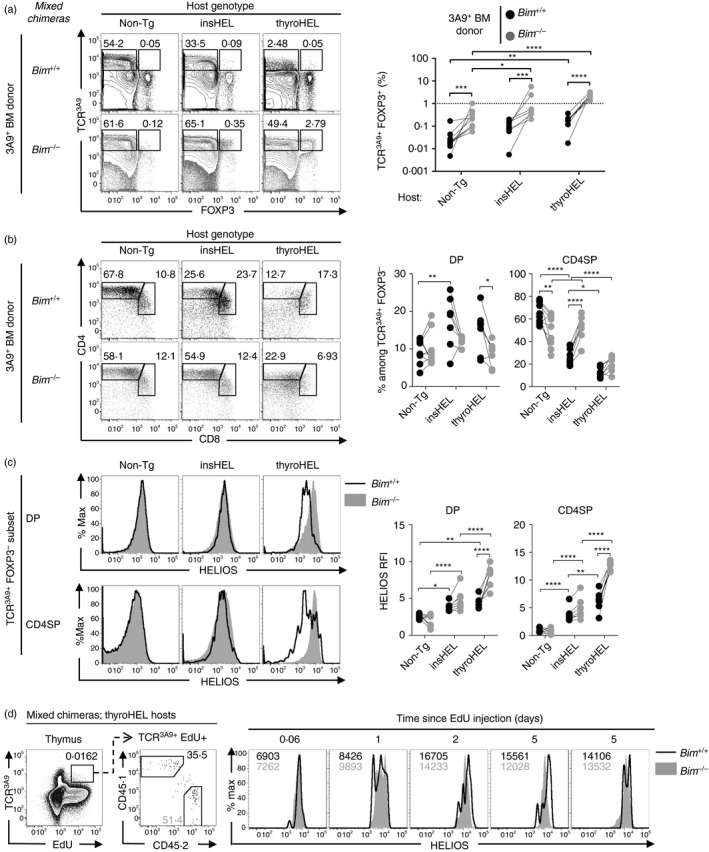
Phenotypes of 3A9 thymocytes rescued from deletion by a defect in apoptosis. Mixed bone marrow (BM) chimeras were generated by reconstituting irradiated non‐transgenic (Non‐Tg) (n = 9), insulin promoter‐driven hen egg lysozyme transgene (insHEL) (n = 7) or thyroglobulin promoter‐driven hen egg lysozyme transgene (thyroHEL) (n = 7) hosts with a cell mixture comprising 90% CD451/2 Bim +/+ Non‐Tg BM, 5% CD451/1 Bim +/+ 3A9 BM and 5% CD452/2 Bim –/– 3A9 BM. (a) Six weeks post‐reconstitution, electronically gated CD451/1 (Bim +/+) and CD452/2 (Bim –/–) thymocyte populations were analysed for expression of TCR3A9 and Foxp3 (left) with a summary graph showing the TCR3A9+ Foxp3+ cell frequencies within the CD451/1 and CD452/2 populations as gated in the plots (right). (b) CD4/CD8 phenotype of Bim +/+ or Bim –/– TCR3A9+ Foxp3– thymocytes (left) and summaries (right) show the double‐positive (DP) and CD4 single‐positive (CD4SP) cell frequencies as gated in the plots. (c) Helios expression on the DP and CD4SP subsets gated in (b) with a summary showing the Helios relative fluorescence intensity (RFI) values relative to Non‐Tg DP thymocytes analysed in parallel (right). (d) ThyroHEL hosts were injected intraperitoneally with EdU at the indicated times before analysis. Representative plots show the gate for the EdU+ TCR3A9+ population (first column) that was divided into CD451/1 (Bim +/+) and CD452/2 (Bim –/–) subsets (second column) that were compared for Helios expression with the mean fluorescence intensity of Bim +/+ and Bim –/– cells shown in black and grey text, respectively (columns 3–7). Each pair of symbols joined by a line in (a–c) and each histogram overlay in (d) represents one mixed chimera. Statistical comparisons used two‐way analysis of variance with Sidak's multiple comparisons test. *P < 0·05; **P < 0·01; ***P < 0·001; ****P < 0·0001.
