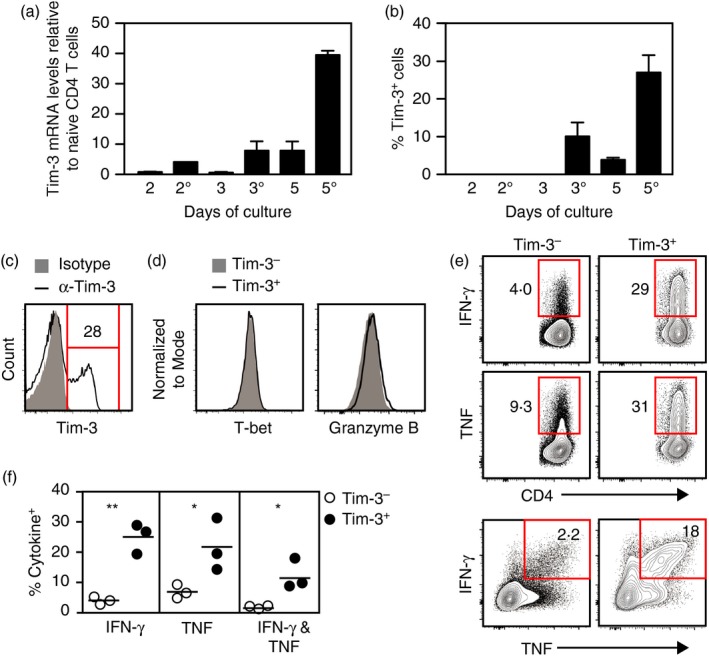
Figure 1.

Tim‐3+ T helper type 1 (Th1) cells generated by acute stimulation in vitro have enhanced effector function. (a,b) CD4 T cells were cultured under Th1 conditions, harvested and analysed. Cells were harvested on days 2, 3 and 5 of culture (denoted as 2, 3 and 5). Additionally, cells taken at these time‐points were washed, restimulated overnight on plates coated with anti‐CD3 antibody and harvested (denoted as 2°, 3° and 5°). (a) Tim‐3 mRNA expression levels. Tim‐3 mRNA levels were normalized to those detected in naive CD4 T cells, which were set at 1. (b) Frequencies of cells expressing Tim‐3 on their surface as determined by flow cytometry. (c–f) Cells were cultured under Th1 conditions for 5 days, harvested, and restimulated overnight on plates coated with anti‐CD3 antibody. (c) Surface expression of Tim‐3. Isotype denotes staining with a non‐specific isotype‐matched antibody. (d) T‐bet and Granzyme B expression by Tim‐3− and Tim‐3+ cells. (e) Interferon‐γ (IFN‐γ) and tumour necrosis factor (TNF) expression by Tim‐3− and Tim‐3+ cells. (f) Frequencies of IFN‐γ‐ and TNF‐expressing cells within Tim‐3− and Tim‐3+ populations as calculated from data represented in (e). For (a) and (b), bars represent the mean and standard error of values from two independent experiments. Data shown in (c), (d) and (e) are representative of results from at least two independent experiments. Circles in (f) each represent a result obtained from an independent experiment (n = 3). *P < 0·05; **P < 0·01. [Colour figure can be viewed at http://wileyonlinelibrary.com]
