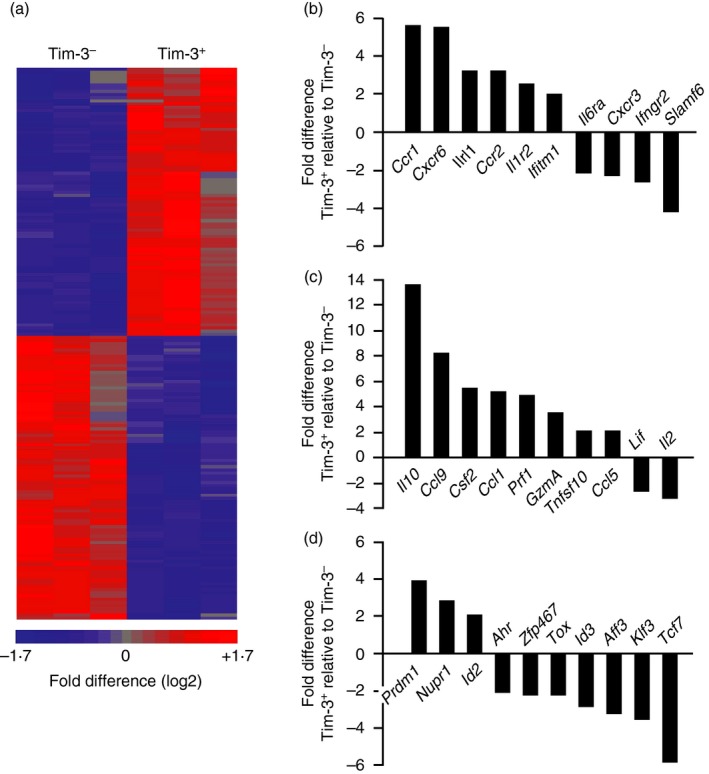
Figure 2.

Tim‐3− and Tim‐3+ T hekper type 1 (Th1) cells show distinct gene expression patterns. CD4 T cells were differentiated under Th1 conditions, harvested, and restimulated for 6 hr on plates coated with anti‐CD3 antibody. Tim‐3− and Tim‐3+ CD4 T cells were sort‐purified and used to isolate RNA for microarray analysis. (a) Heat map generated by unbiased clustering of data sets from Tim‐3− and Tim‐3+ cells. Each column represents data obtained from an independent experiment (n = 3 total). Significant differences in the expression of 128 genes are shown. (b–d) Differential expression of genes encoding (b) cell surface proteins and receptors, (c) secreted factors and (d) transcription factors. [Colour figure can be viewed at http://wileyonlinelibrary.com]
