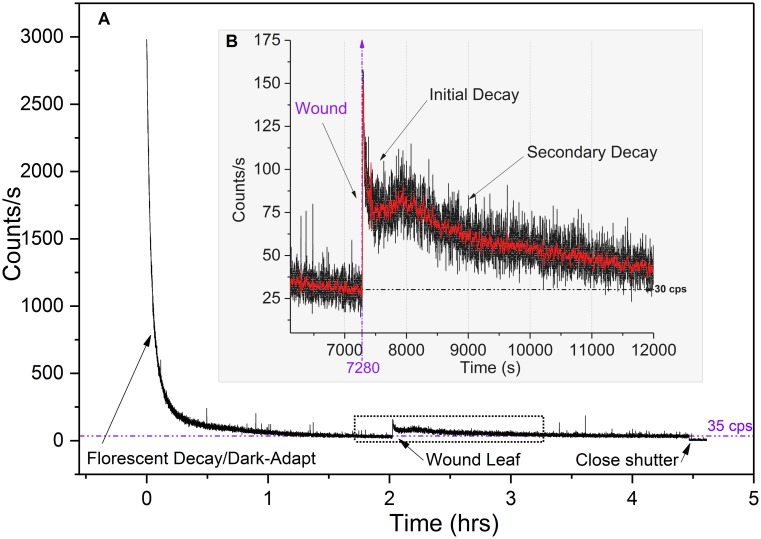
Fig 5. Aerobic wound decay trends.
Typical hyperbolic and dual post wound exponential decays (in air). (A) Complete fluorescent decay/dark adapt—wounding profile. (B) Enlarged view of wounding data. Note primary and secondary post wound decays. Red curve is 25-point data smoothing for trend visibility.

