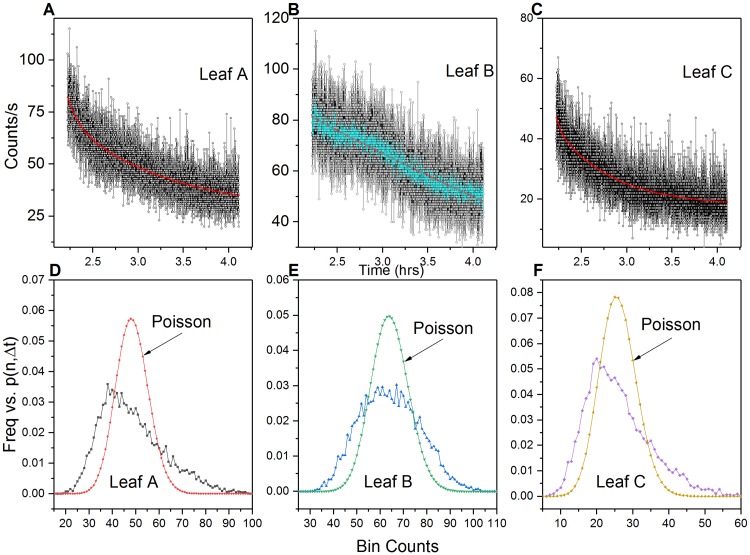
Fig 10. Aerobic post wound secondary exponential decay.
Leaves A, B, & C photocounts with double exponential decay fit line (red) (A-C). Leaf B (B) did not display a secondary decay peak. Cyan curve in (B) is 10 pt smoothed to highlight the decay profile. Red lines (A, C) reflect double exponential curve fit. (D-F) Observed photon count frequency vs. Poisson predicted distribution for each leaf (μA = 48.55; μB = 64.19 and μC = 25.90).

