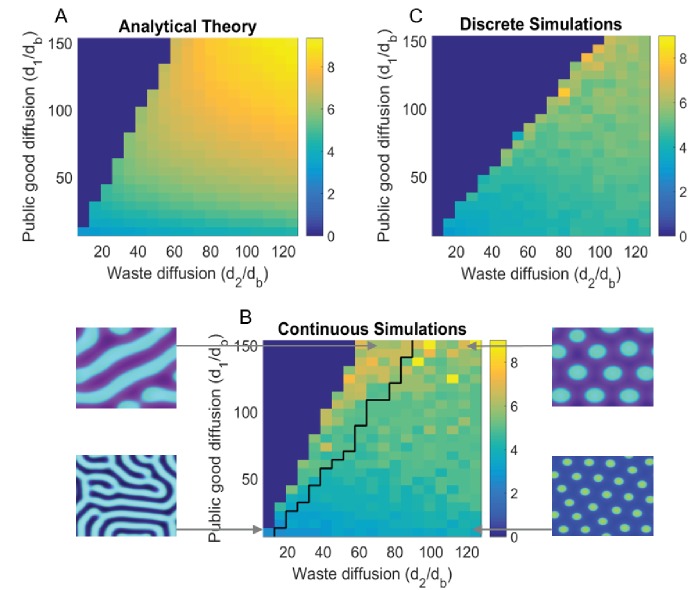
Figure 3. Turing analysis results.
The top-left figure, (A) shows the group size as obtained by our theoretical analysis (appendix); whereas the bottom figure, (B) shows the same for continuous simulations, and the top-right figure, (C) is for agent based simulations. The black line in (B) divides parameters that give rise to striped patterns, and those that give rise to spots, corresponding images are shown to the left and right of (B). Due to the discreteness of the agent based simulations, Turing patterns are not always stable where they might be in the continuous analogue. We see that the discrete simulations cut off around where we would see stripes in the continuous case, and do not see striped patterns in the discrete case. For different sets of parameters, we can also see Turing patterns in the discrete-stochastic case where they might not occur in the continuous case. For the region where Turing patterns are stable, the continuous theory gives a good prediction of group size and group reproduction rate. The Matlab code and data for this figure is provided in Figure 3—source data 1.

