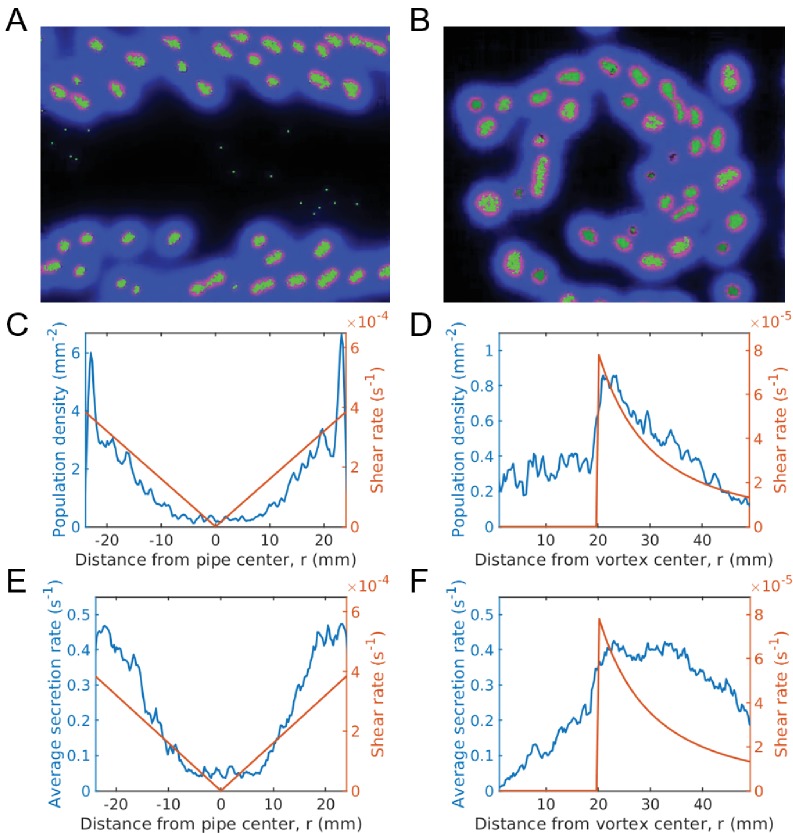
Figure 6. Evolution of sociality in pipe and vortex geometries (continuum of secretion rates).
The top row gives simulation snapshots of the system in a Hagen-Poiseuille flow in a pipe (A) and of the system in a Rankine vortex (B). The middle row gives the average microbial population and the shear rate magnitude versus distance from the center of the pipe (C) and the center of the Rankine vortex (D). Since shear is spatially dependent, the population is localized in regions of large shear. For Hagen-Poiseuille flow, we see that the population is larger at the boundaries, where the shear is also larger (C). This is because groups fragment quicker at the boundaries and are able to overcome take-over by mutation, whereas near the center they cannot. For the Rankine vortex we also see that the population follows very closely to the shear (D), which suggests that the growth is proportional to shear. We caution that this holds in the low density limit. At higher densities the population saturates and is no longer proportional to shear. The bottom row gives the average public good secretion rates of the entire population for Hagen-Poiseuille flow (E) and for Rankine vortex flow (F). Again, regions of larger shear admit more cooperative populations with larger public good secretion rates. Simulations were run for a duration of s under a mutation rate of and data was averaged over 200 runs. The undulations observed in the population plots are due to the finite size of the groups. Groups form layers of width equal to the group diameter. The population curve therefore shows undulations of width equal to the group width. Simulation videos of Hagen-Poiseuille flow and Rankine vortex flow are provided in Videos 4, 5 and Matlab code and data for (C)-(F) is given in Figure 6—source data 1.

