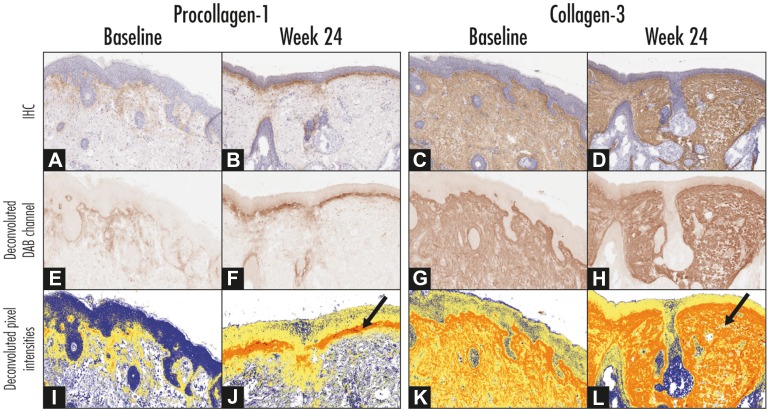
Fig. 3.
Representation of image processing used for quantitative immunohistochemistry studies of procollagen-1 (left panel) and collagen-3 (right panel). a–d Expression of procollagen-1 and collagen-3 (brown color). e–h The Aperio Color Deconvolution Algorithm (Aperio Technologies, Vista, CA, USA) was used to analyze diaminobenzidine (DAB) substrate staining applied to each slide. Strong positive staining intensity within the dermoepidermal junction was measured. i–l Staining intensity illustrated as a heatmap where blue = no staining, yellow = low intensity, orange = medium intensity, and red = high intensity staining (denoted by arrows)

