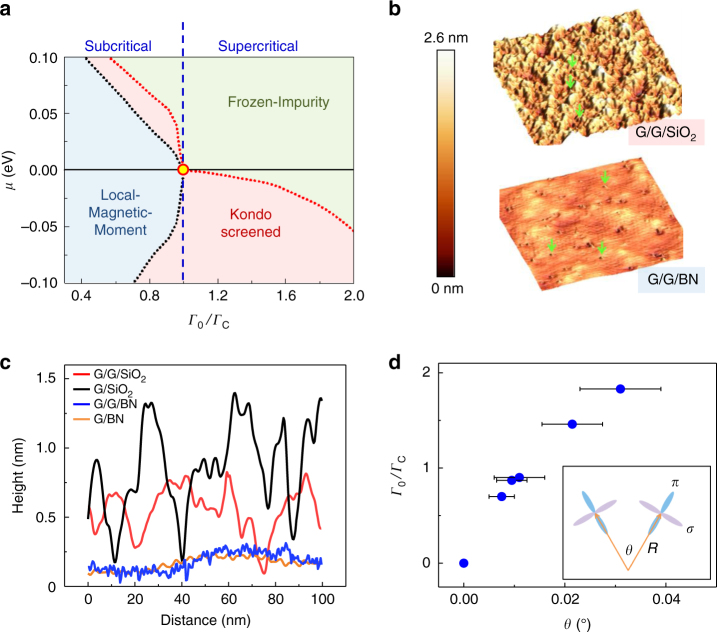
Fig. 4.
Quantum phase transition and Kondo screening. a μ−Γ0 phase diagram at 4.2 K. The critical coupling ΓC (circle at Γ0/ΓC = 1.0) designates the boundary between Frozen-Impurity and the Local-Magnetic-Moment phases at μ = 0. Dotted lines represent boundaries between the phases (Supplementary Note 8). b STM topography for the G/G/SiO2 (top) and G/G/BN (bottom) samples with the same scale bar (Vb = −300mV, I = 20pA). The arrows point to the vacancies. c Typical line profile of the STM topographies of graphene on different substrates with the same scanning parameters as in b. d The evolution of the hybridization strength with the curvature. Error bars represent the uncertainty in obtaining the angle between the σ-orbital and the local graphene plane orientation from the local topography measurements. Inset: sketch of the curvature effect on the orbital hybridization

