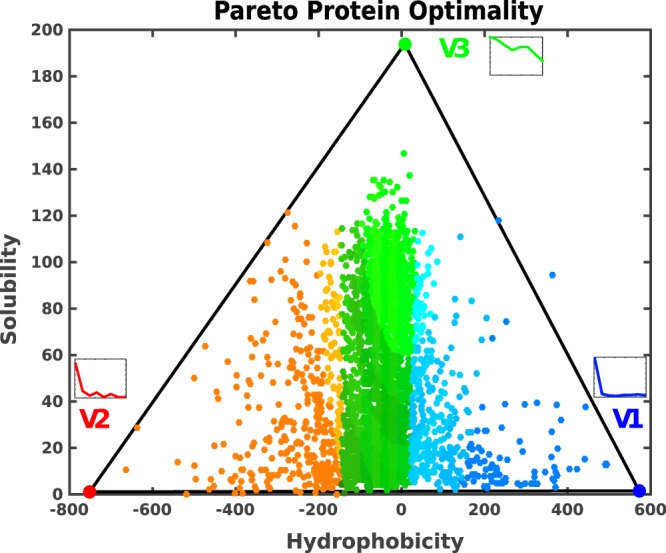
Figure 1.

Solubility-hydrophobicity triangle. We show a scatter plot of the 3,172 proteins of the Escherichia coli proteome. Each protein is represented as a point whose coordinates are the values of its hydrophobicity and solubility. The Pareto front is the triangular-hull that exhibits a low p-value of the order of 5 · 10−3, confirming the statistical significance of the plotted distribution (see the Supplementary Information for more details). Proteins whose points lie inside the triangle are the best compromise in the multi-objective optimization of the three tasks, which are better performed by the corresponding archetypes located at the three vertices. Points outside the triangle would have a better counterpart inside the triangle in at least one of the tasks. The RGB colors identify the distribution of the integral inner membrane (blue), outer membrane, and outer membrane bounded periplasmic (red) and cytoplasmic (green) proteins, which also characterize the vertices.
