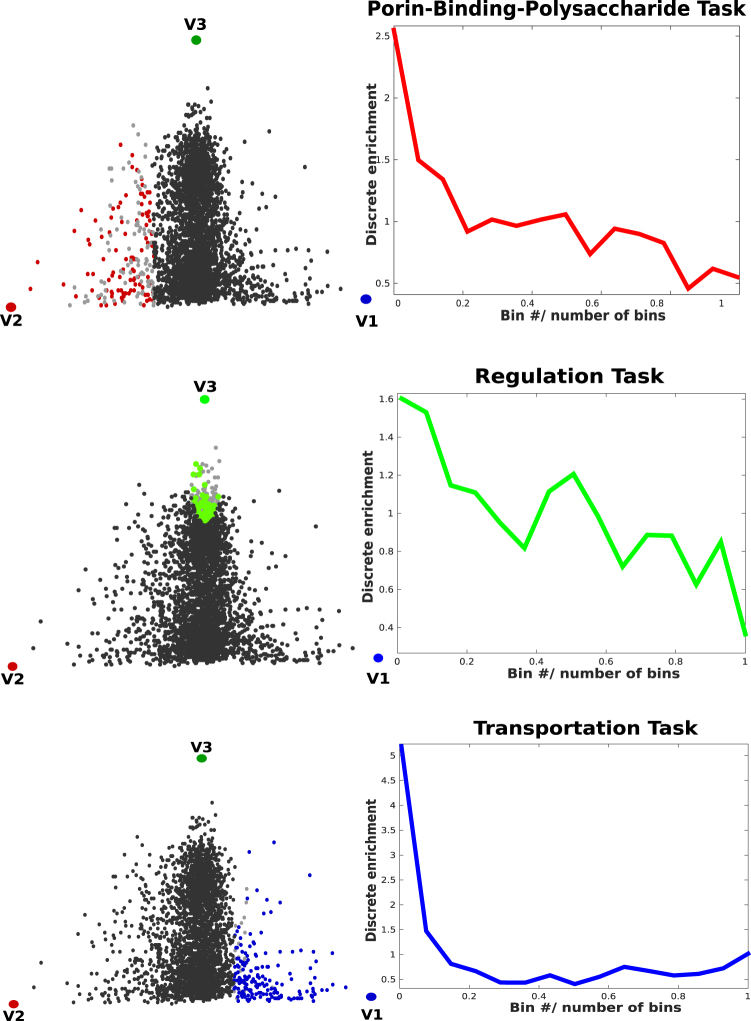
Figure 2.
Enrichments. Enrichment plots as a function of the distance from the corresponding archetype. Pareto optimality is defined such that the points closest to the vertices of the triangle must be maximally enriched in some features (they behave as specialists or “pure” types). All the tasks (GO-terms) that enrich each vertex are added together. Next to the enrichment plot, the proteins are mapped in the solubility-hydrophobicity plane. The colors highlight the enriched proteins belonging to the first bin. The vertices in the figures (V1, V2 and V3) label the protein subcellular localizations (as presented in Fig. 1), namely, cytoplasmic proteins (green), integral inner membrane proteins (blue), outer membrane, and uter membrane bounded periplasmic proteins (red).

