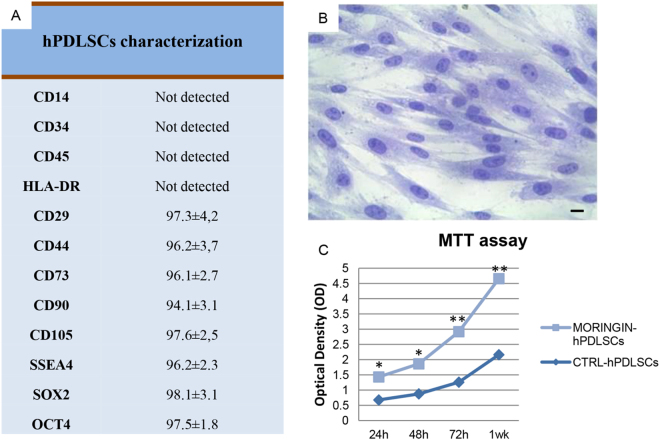
Figure 1.
hPDLSCs characterization. (A) Cytofluorimetric evaluation of human PDLSCs surface markers. The numbers in the panel represented the percentage of markers expression in the cells (B) hPDLSCs stained with toluidine-blue solution. Scale bar: 10 μm (C) hPDLSCs were treated with moringin at a concentration of 0.5 μM for 24 h, 48 h, 72 h and 1 week of culture. The cell proliferation was determined using MTT assay. The means ± SEM of three independent experiments performed in triplicate are shown. *P < 0.05; **P < 0.01.

