
Figure 2.
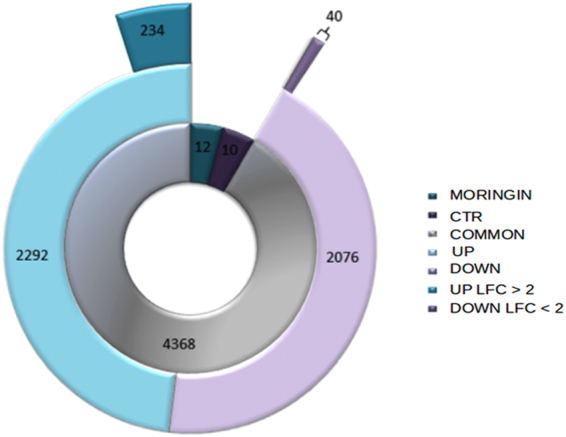
Global gene expression. In the chart, the inner ring corresponds to the total number of genes statistically significant, among these the gray part (4368) represents the common genes differentially expressed in both conditions, which are control (CTR-hPDLSCs) and cells treated with 0.5 μM of moringin (MORINGIN-hPDLSCs). Instead the two remaining small parts of the inner ring indicate the number of genes expressed only in the CTR-hPDLSCs (10) and in the MORINGIN-hPDLSCs (12). In the second ring the portion of common genes is divided into upregulated (2076) and downregulated (2292) genes. The third ring shows the genes upregulated (40) and downregulated (234) that have a Log2 Fold Change (LFC) > 2.