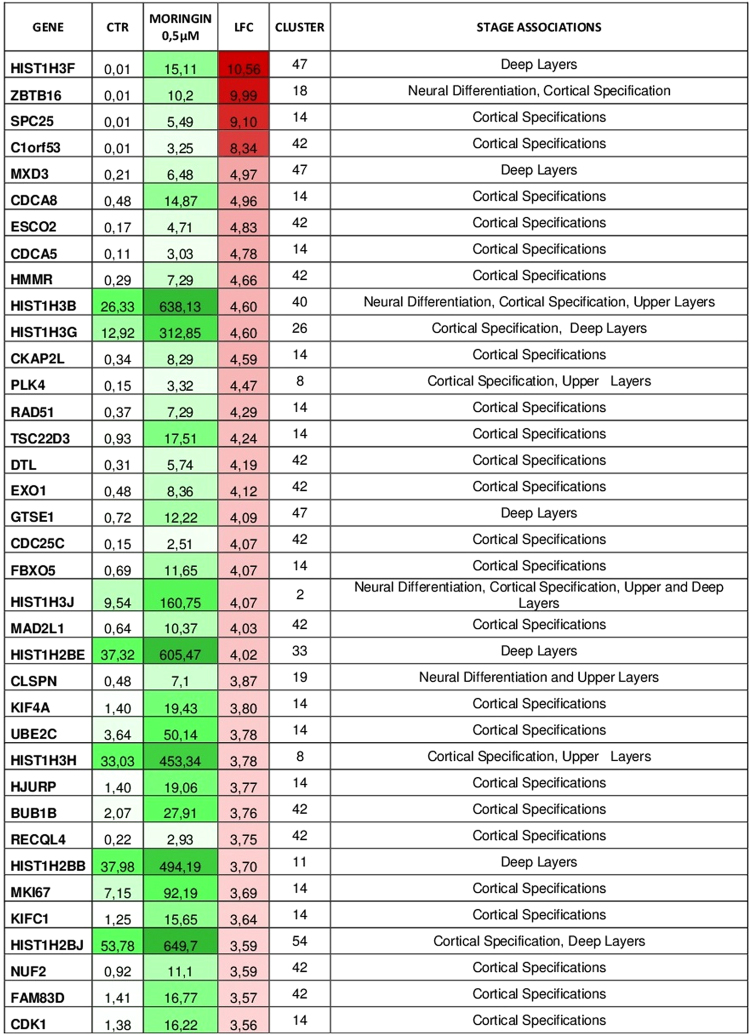
Figure 4.
Differentially expressed genes involved in cerebral cortex development induced by 0.5 μM of moringin. Heat maps show differentially expressed genes that have Log2FoldChange (LFC) > 2 (red scale) and a q-value (FDR) < 0.05, hence genes that after treatment with 0.5 μM of moringin appear overexpressed and statistically significant. The expression’s values in the two conditions, CTR-hPDLSCs and MORINGIN-hPDLSCs, are indicated through the FPKM (Fragments Per Kilobase of exon model per Million mapped fragments) and graphically depicted in green scale, where a different intensity of color represents a differential gene expression, that is also reported in column 4 as fold change value (red color). In column 4 a more intense red color is associated to a higher fold change value. Gene cluster and stage association analyzed by Cortecon database were also shown.

