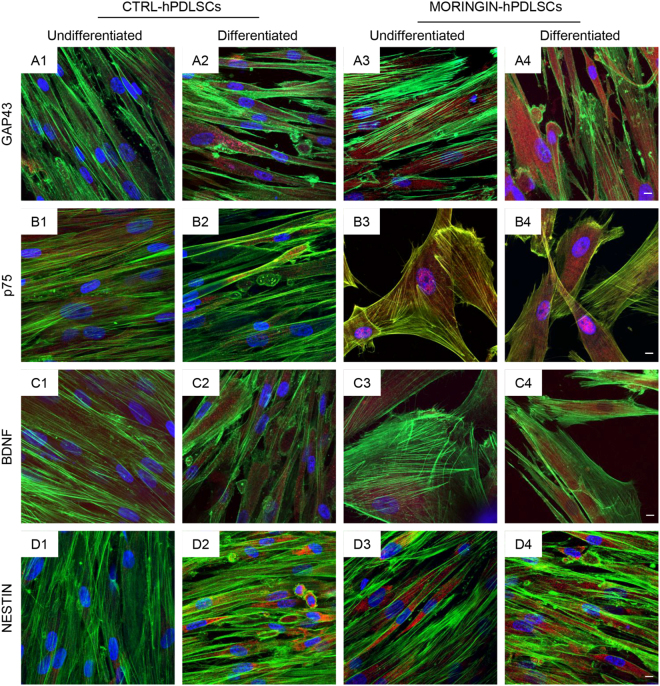
Figure 7.
hPDLSCs neurogenic differentiation. Images of immunofluorescence staining in CTRL-hPDLSCs and MORINGIN-hPDLSCs after 10 days of culture in undifferentiated and differentiated conditions. Evaluation of different expression level of GAP43 (A1,A2,A3,A4), p75 (B1,B2,B3,B4), BDNF (C1,C2,C3,C4) and NESTIN (D1,D2,D3,D4). Mag: 40×. Bar: 50 µm.

