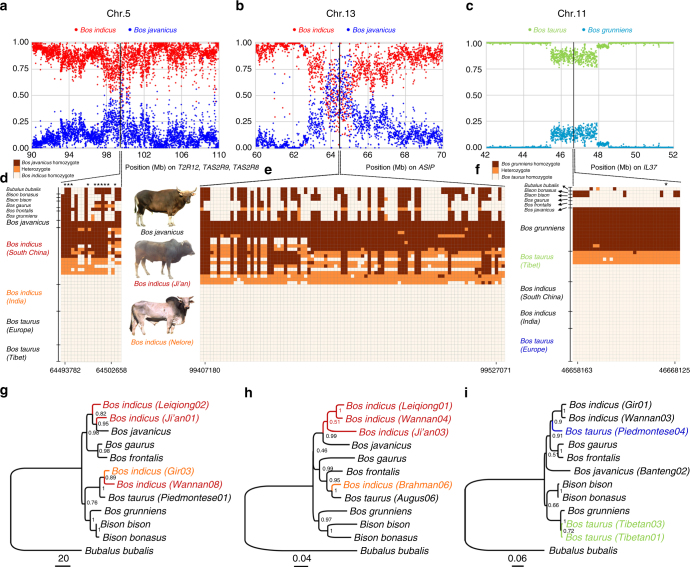
Fig. 5.
Phylogenetic analyses of SNP data confirm the Bos javanicus introgression into Chinese indicine cattle or the yak introgression into Tibetan taurine cattle. a, b Bos javanicus introgression plots constructed based on whole-genome sequencing data from two representative segments on chromosomes 5 and 13. The relative frequencies of Bos indicus-specific alleles are in red dots while Bos javanicus-specific alleles in blue dots. Bos javanicus-specific alternate alleles were identified as those that appeared in Bos javanicus genomes and were absent from taurine and Indian indicine cattle genomes. c Yak introgression plots constructed based on whole-genome sequencing data from a reprehensive segment on chromosome 11. The yak-specific alleles were identified using the same method. The relative frequencies of Bos taurus-specific are in green dots while Bos grunniens-specific are in sky blue. Vertical mouldings in d–f represent the SNP regions on chromosomes 5, 13 and 11 used for neighbour-joining (NJ) phylogeny analysis. The patterns of high-frequency SNPs at the T2R12, TAS2R9 and TAS2R6 regions are shown in d, at the ASIP region in e and at the IL-37 region in f. The star (*) denotes non-synonymous SNPs. Nucleotides with brown box in d and e represent Bos javanicus-specific homozygote genotypes, and with orange box represent heterozygote genotypes. Nucleotides with brown box in f represent Bos grunniens-specific homozygote genotypes. NJ phylogeny of 12 haplotypes supporting the introgression of banteng into Chinese indicine cattle (g, h) and the introgression of yak into Tibetan taurine cattle (i). The reliability of the tree branches (shown at the nodes) is tested with 1000 bootstrap replicates

