Fig. 3.
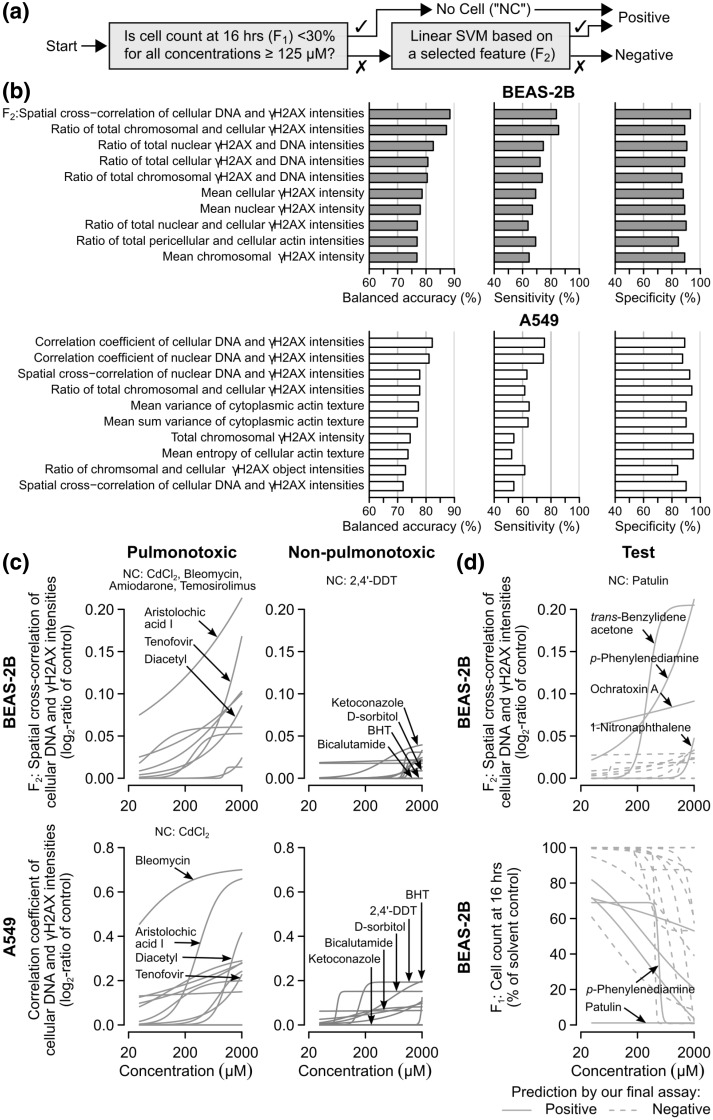
BEAS-2B cell count and co-localization of γH2AX and DNA are highly predictive of pulmonotoxicity. a Schematic showing a cascade classifier that uses, in succession, the cell count (F1) and a selected phenotypic feature (F2) at 16 h to classify pulmonotoxic and non-pulmonotoxic reference chemicals. b Bar charts showing the test balanced accuracies, sensitivities, and specificities of the top 10 phenotypic features estimated using the cascade classifier and a tenfold cross-validation procedure (“Materials and methods”). The feature with the highest estimated test balanced accuracy is the “spatial cross correlation of cellular DNA and γH2AX intensities in BEAS-2B cells” (F2). c Concentration–response curves of the reference chemicals (red = pulmonotoxic, and blue = non-pulmonotoxic) based on the best performing BEAS-2B (top) and A549 (bottom) phenotypic features (BHT = butylated hydroxytoluene). d Concentration–response curves of the test chemicals (green) based on F1 (bottom) and F2 (top) of BEAS-2B cells. A final assay based on F1 and F2 was trained on all the reference chemicals and applied to these test chemicals (solid lines = predicted to be positive, dashed lines = predicted to be negative by the final assay). (Color figure online)

