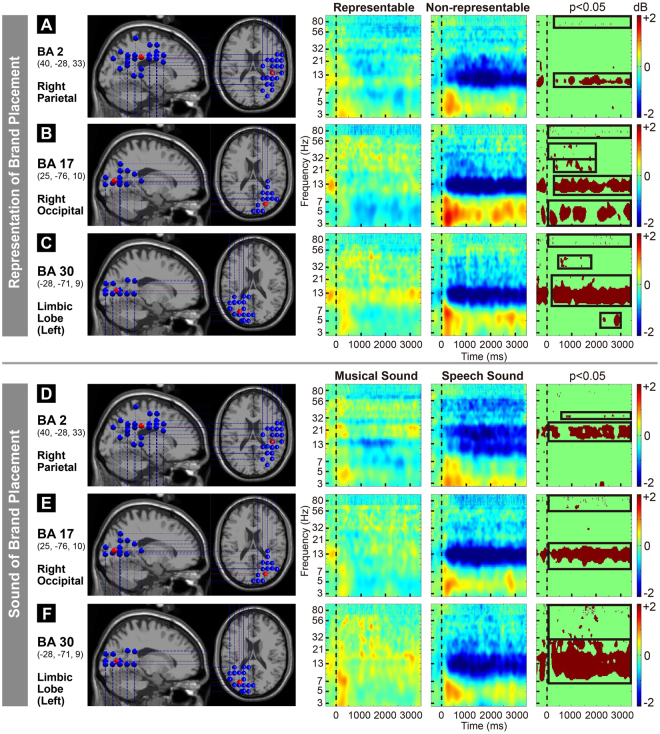
Figure 5.
Event-related spectral perturbation (ERSP) results of the 25 participants for different brand placement representations and sounds. False discovery rate analysis was performed for significance testing. (A–C) Brain regions and ERSP(s) results are shown, with significant differences between REBPL and NREBPL. The two factors indicate significant differences in the spectral powers of theta, alpha, beta, and gamma for Brodmann areas BA 2, BA 17, and BA 30 (p < 0.05). (A) In BA 2, REBPL shows a higher spectral power for 7–13 Hz (alpha) than NREBPL (p < 0.05), and NREBPL shows a higher spectral power for 80–100 Hz (high gamma) than REBPL (p < 0.05). (B) In BA 17, NREBPL shows a higher spectral power for 3–6 Hz (theta) than REBPL (p < 0.05); REBPL shows a higher spectral power for 9–20 Hz (alpha, beta) than NREBPL (p < 0.05); REBPL shows a higher spectral power for 20–30 Hz (beta) than NREBPL (p < 0.05); REBPL shows a higher spectral power for 30–60 Hz (low gamma) than NREBPL (p < 0.05); and NREBPL shows a higher spectral power for 60–100 Hz (high gamma) than REBPL (p < 0.05). (C) In BA 30, NREBPL shows a higher spectral power for 4–6 Hz (theta) than REBPL (p < 0.05); REBPL shows a higher spectral power for 9–20 Hz (alpha, beta) than NREBPL (p < 0.05); REBPL shows a higher spectral power for 30–40 Hz (low gamma) than NREBPL (p < 0.05); and NREBPL shows a higher spectral power for 60–100 Hz (high gamma) than REBPL (p < 0.05). (D–F) Brain regions and ERSP(s) results are shown, with significant differences between SSBPL and MSBPL. The two factors indicate significant differences in the spectral powers of alpha, beta, and gamma for Brodmann areas BA 2, BA 17, and BA 30 (p < 0.05). (D) In BA 2, MSBPL shows a higher spectral power for 15–15 Hz (beta) than SSBPL (p < 0.05), and MSBPL shows a higher spectral power for 30–40 Hz (low gamma) than SSBPL (p < 0.05). (E) In BA 17, MSBPL shows a higher spectral power for 10–20 Hz (alpha, beta) than SSBPL (p < 0.05), and MSBPL shows a higher spectral power for 60–100 Hz (high gamma) than SSBPL (p < 0.05). (F) In BA 30, MSBPL shows a higher spectral power for 7–30 Hz (alpha, beta) than SSBPL (p < 0.05), and MSBPL shows a higher spectral power for 30–100 Hz (low gamma, high gamma) than SSBPL (p < 0.05).

