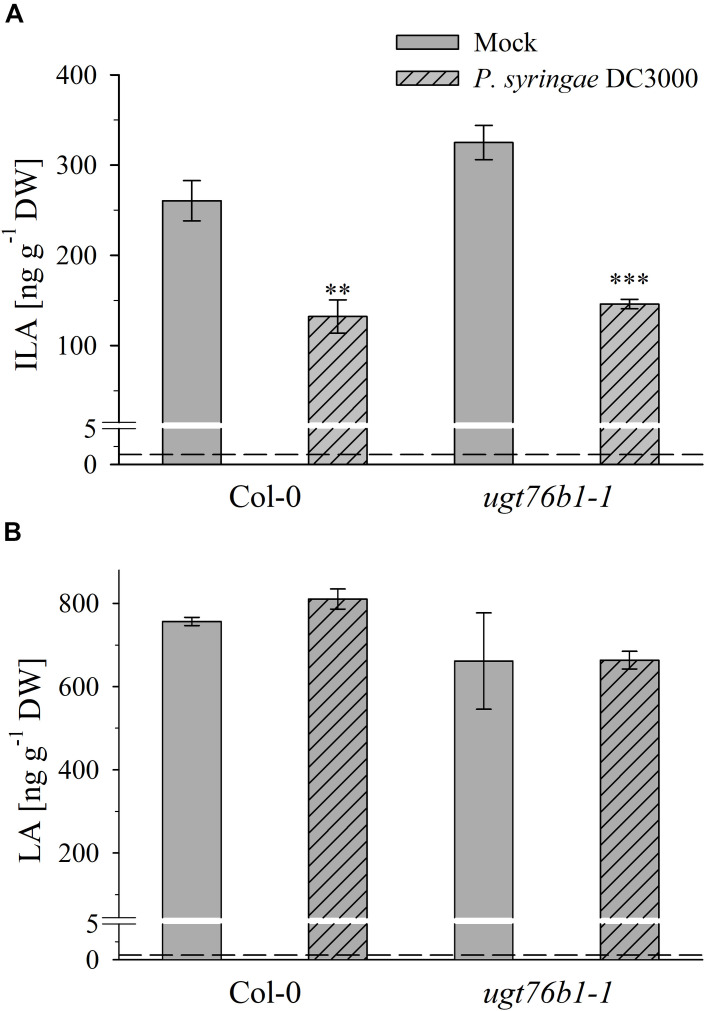
FIGURE 7.
Isoleucic acid and LA abundance in response to Pseudomonas syringae virulent strain infection. Levels of (A) ILA and (B) LA aglyca 24 h post P. syringae DC3000 infection in leaves of Arabidopsis Col-0 and ugt76b1-1 plants compared to mock controls. Means ± SE (n = 4) are plotted. Asterisks indicate statistically significant treatment effect compared to mock control (t-test), ∗∗p < 0.01, ∗∗∗p < 0.001. Dashed lines indicate the limit of detection (see section “Materials and Methods”).

