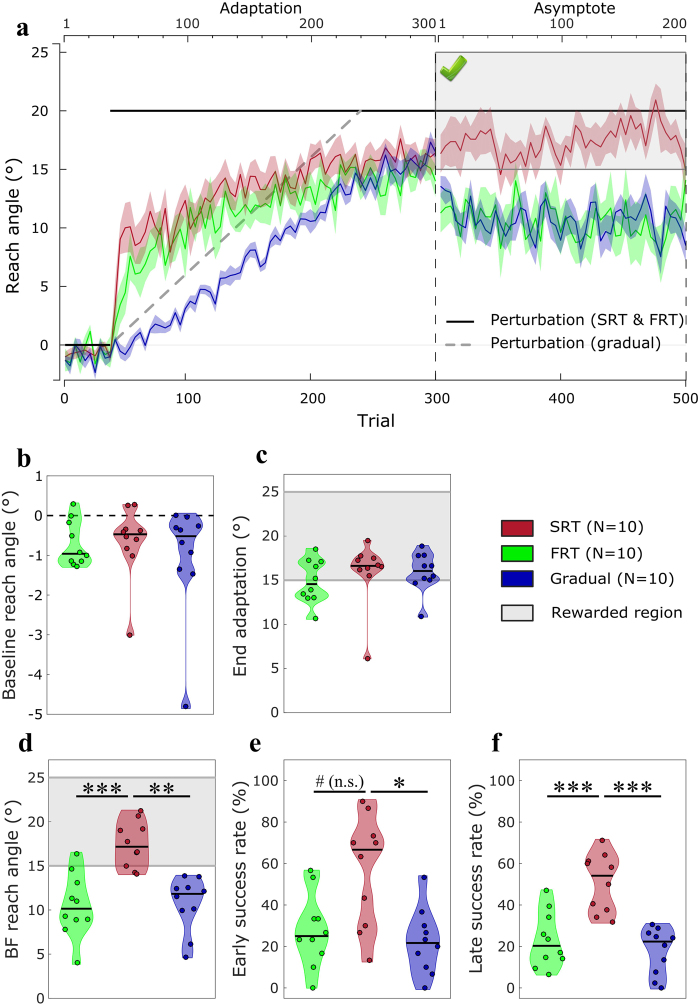
Figure 3.
Experiment 2: forced RT. (a) Reach angles with respect to target (°) of each group during the visuomotor displacement task. Values are averaged across epochs of 4 trials. Vertical bars represent block limits. The binary feedback consisted of a large green tick displayed on top of the screen if participants were within the reward region (see figure), and of a red cross if they were not (not shown). The black solid line represents the hand-to-cursor discrepancy (the perturbation) for the SRT and FRT group across the task, and the grey dashed line represents the perturbation for the Gradual group only. The upper and lower horizontal axes represent block-relative and absolute trial number, respectively. Coloured lines represent group mean and shaded areas represent s.e.m. (b) Average reach angle of participants during baseline. Of note, the y axis is on a smaller scale than the following figures (c) Average reach angle during the last 20 trials of the adaptation phase. The shaded grey area represents the region to be rewarded in the subsequent asymptote phase. (d) Average reach angle during the asymptote block. The shaded grey area represents the rewarded region. (e) Success rate during the first 30 trials of the asymptote phase. (f) Success rate during the remainder of the asymptote phase (trial 331–500). Each dot represents one participant. For the distribution plots, horizontal black lines are group medians and the shaded areas indicate distribution of individual values. SRT: short reaction time; FRT: fast reaction time. #p = 0.059; ***p < 0.001; **p < 0.01; *p < 0.05.

