Figure 6.
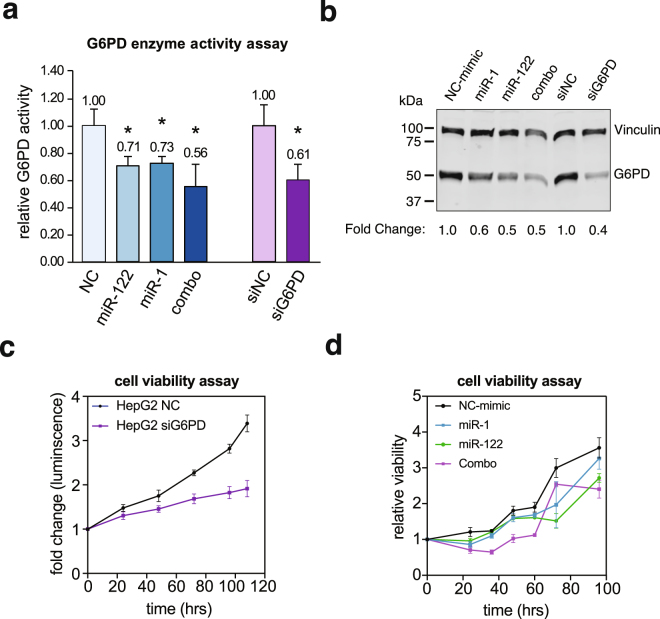
G6PD expression and activity are suppressed by miR-122 and miR-1 in HepG2 cells. HepG2 cells transfected with scrambled miRNA (NC), miR-1, miR-122, combo (miR-1 and miR-122), G6PD siRNA (siG6PD) or negative control siRNA (NC) for 48 hours. (a) G6PD activities in these cells were determined by measuring NADPH absorbance at 341 nm and calculating the NADP+/NADPH ratios. Asterisks indicates p-value < 0.05, p-value was calculated using two-tailed Student T-test). (b) Immunoblotting of G6PD protein was performed in the lysates. G6PD levels were normalized to that of vinculin. (c,d) Cell viability measured using CellTiter-Glo® Luminescent kit. Cell viability over time was determined as change in luminescence from 0-hour time point. Cropped immunoblot images in (b) were obtained from the same gel. Full immunoblot images are found in supplemental material.

