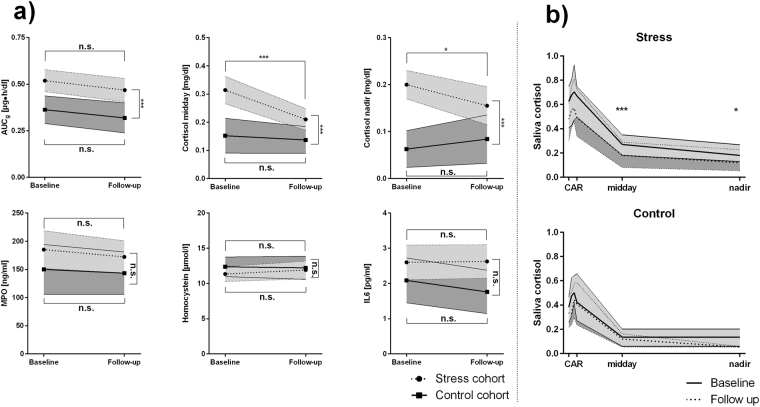
Figure 4.
(a) Temporal development of biomarkers. Estimated marginal means are calculated by general linear models (two-way ANOVA with repeated measurements design) and p-values were adjusted according to Benjamini and Hochberg. Data is given as estimated marginal mean and 95% confidence interval, and confidence intervals from stress patients are light grey shaded, whereas confidence intervals from controls are dark grey shaded. (b) Variation in cortisol day profiles at baseline (light grey) and before follow-up examinations (dark grey) within the stress (top) and the control cohort (bottom). AUCg, area under the curve with respect to ground; AUCi, cortisol awakening response – area under the curve with respect to increase; MPO, plasma myeloperoxidase; IL6, interleukin 6; n.s., not significant; ***pBH < 0.001; *pBH < 0.05.

