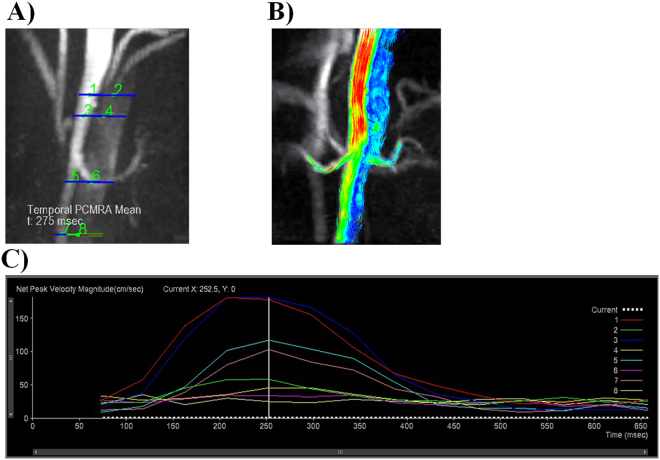
Figure 2.
Different levels of flow, velocity, and volume measurements. (A) Example of analysis plane selection. TL: 1,3,5, and 7 and FL: 2,4,6, and 8. (B) Color-coded streamlined visualization of the faster flow through the TL relative to the FL. (C) Time curves of peak velocity magnitude indicating the changes in the blood flow parameters during the cardiac systolic and diastolic phases. They represent the velocity-time curves at different locations in the TL and FL.

