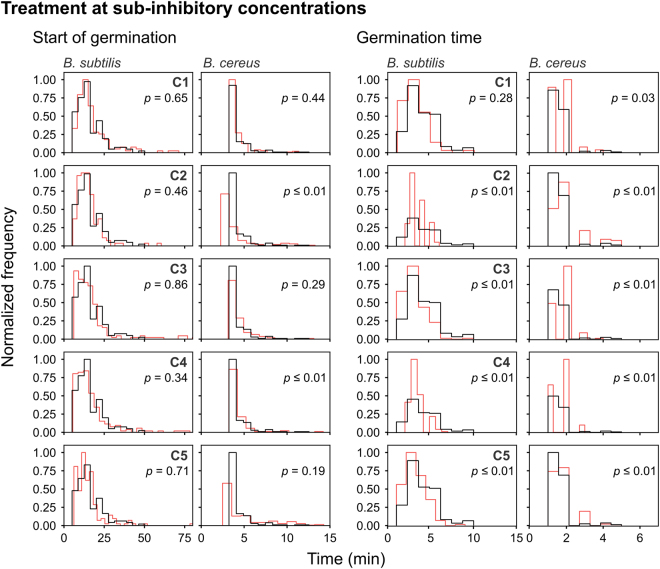
Figure 5.
Frequency distribution curves of B. subtilis and B. cereus spores treated at sub-inhibitory concentrations of C1, C2, C3, C4 and C5 (red line). The start of germination and germination time are depicted. Treated conditions were overlaid with the untreated B. subtilis and B. cereus spores (black line). The histogram was normalized to occupy an area of one and was rescaled so that the maximum value in the histogram is equal to one. Significance of differences between the median values of the two groups was assessed using the Mann-Whitney test. Observations of two biological repeats were grouped and analysed as one data set. See Table 3 for the concentrations used.

