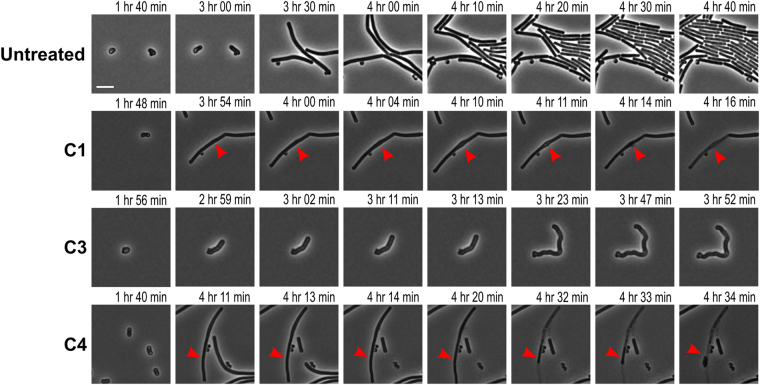
Figure 8.
Snapshots of the live imaging results of B. subtilis spores untreated and treated with sub-inhibitory concentrations of C1, C3 and C4. Absolute time of the live cell imaging are shown from the start of sample preparation. Treatment with C1 show the start of cell wall damage 3 hrs and 54 min after the start of measuring, but cell lyse only occur 2.5 hrs after spore bursting (red arrows). Treatment with C3 resulted in enlarged cells that appeared to be swelling directly after bursting. The deformed cells appear to not divide, but elongate into a cell with irregular curvatures. Treatment with C4 also resulted in cell lysis 2.5 hrs after spore bursting (red arrows). Scale bar represent 2 µm.

