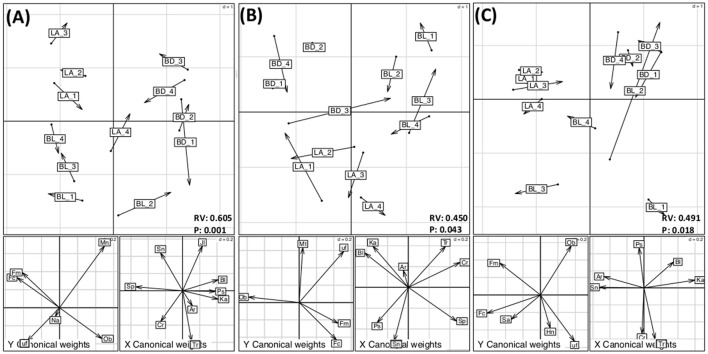
Figure 3.
Co-inertia analysis showing the relationship between rhizosphere bacterial and fungal core and eco microbiomes in (A) canola grown as recommended (Can_RE), (B) canola fertilized at 150% of the recommended rate (Can_HF), and (C) canola seeded at 150% of the recommended rate (Can_HD). For each treatment, the top graph is the projection of both bacterial and fungal operational taxonomic units (OTUs) onto the co-inertia plane. The cumulative projective inertias for the first two axes were (A) 92.58%, (B) 96.49%, and (C) 95.88% of the total variation. The label abbreviations are as follows: BL, Beaverlodge; BD, Brandon; LA, Lacombe. Arrow length is proportional to the difference between the ordinations of the two data sets: longer arrows denote less concordance between the two assemblage data sets. The two lower panels are the projection of fungi (left panel) and bacteria (right panel) onto the co-inertia plane for each treatment. The abbreviations for bacterial and fungal species are as follows: Ar, Arthrobacter sp.; Bl, Blastococcus sp.; Cr, Cryococcus sp.; Jl, Janthinobacterium lividum; Ka, Kaistobacter sp.; Ps, Pseudomonas sp.; Sn, Stenotrophomonas sp.; Sp, Serratia proteamaculans; Tr, Terracoccus sp.; Fc, Fusicolla sp.; Fm, Fusarium merismoides; Hn, Humicola nigrescens; Ob, Olpidium brassicae; Mn, Monographella cucumerina; Mt, Mortierella sp.; Na, Nectria ramulariae; uf, unclassified fungus. The RV coefficients are the values of the multivariate generalization of the squared Pearson correlation coefficient. P indicates the P-values of each analysis.

