Figure 2.
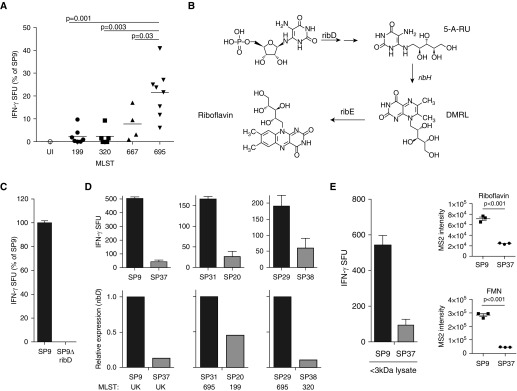
(A) Relative IFN-γ production by D426 G11 in response to SP isolates grouped by multilocus sequence typing (MLST). Statistical significance between MLST group 695 and MLST group 199, 320, or 667 was determined by an unpaired t test with Welch’s correction. (B) SP riboflavin biosynthesis pathway. RibD, RibH, and RibE enzymes are encoded on a single operon. (C) DCs were infected with SP9 or SP9ΔribD and used in an ELISPOT assay as previously described. (D) Top: Indicated SP isolates were cultured, and mucosal-associated invariant T–cell response was analyzed as described in Figure 1. Bottom: At the time the ELISPOT assay was performed, ribD expression in paired isolates was determined by RT-PCR analysis. Isolates were tested in pairs, determined by similar gyrA expression. For C and D, results shown are representative of three independent experiments; error bars are the mean and SD derived from replicate wells. (E) DCs were incubated with the less than 3 kD lysate fractions from SP9 and SP37 in an ELISPOT assay with IFN-γ production by D426 G11 as a readout. Relative ion intensities of riboflavin and flavin mononucleotide (FMN) in less than 3 kD lysate fractions from SP9 and SP37 are shown. Solid circles in the graphs in E represent data derived from triplicate injections. 5-A-RU = 5-amino-6-ribitylaminouracil; DMRL = 6,7-dimethyl-8-ribityllumazine; MS2 = MS/MS fragment spectra; UK = unknown MLST.

