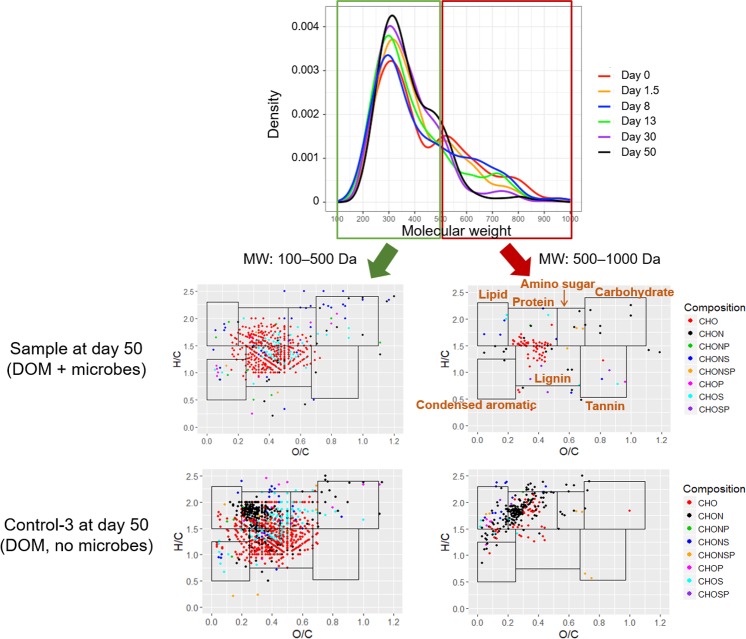
FIGURE 3.
Distribution of molecular weights and van Krevelen diagram of compounds detected by Fourier transform ion cyclotron resonance mass spectrometry (FT-ICR MS) in DOM (one of the three replicates was presented). Boundary limits in van Krevelen diagram to constrain biochemical classifications were given in the Supplementary Materials.

