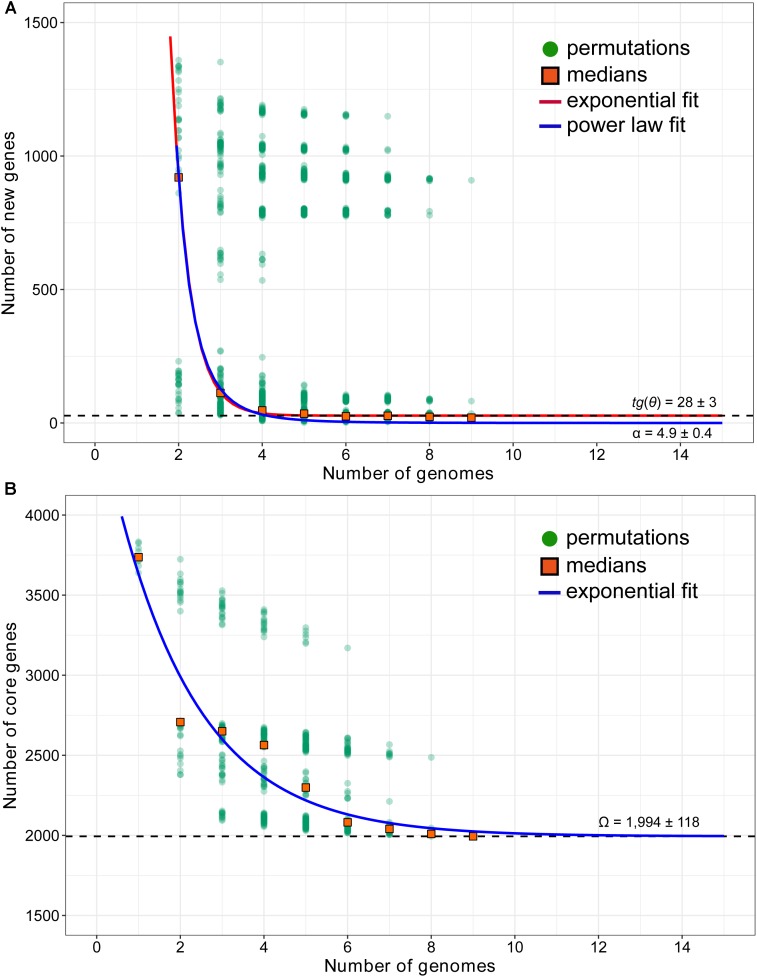
FIGURE 3.
Mathematical extrapolation estimating the new genes (A) and core genome (B) of A. thiooxidans species, based on these sequenced genomes of bacterial strains (except for ATCC 19377). In the new genes extrapolation, new genes were counted by the growth of the gene pool of (n – 1) strains when they were added. For each n, there are N2 = n⋅N1 observations. Orange squares are the medians of such values presented in n strains. The curve in main window represents the least-squares fit of Fs = 𝜀sexp(–n/τs) + tg(𝜃). The optimal fitting was output with adjust R-square = 0.9996 for 𝜀s = 93,320 ± 16,520, τs = 0.43 ± 0.04, and tg(𝜃) = 28 ± 3. The dashed line displays the extrapolated growth rate of pan-genome tg(𝜃). The curve in child window represents the growth curve of pan-genome as the function P(n). In addition, the blue curve is least-squares fit of the power law Ps = κn-α to medians. A threshold parameter (α) is used to distinguish whether the A. thiooxidans pan-genome is open (α ≤ 1) or closed (α > 1); as for core gnome extrapolation, the number of core genes shared by n of strains was plotted. For each n, there are N1 = S!/[(n – 1)!⋅(S – n)!] observations, where S is the numbers of strains. Orange squares are the medians of such values presented in n strains. The blue curve represents the fit least-squares of Fc = 𝜀cexp(–n/τc) + Ω. The optimal fitting was output with adjust R-square = 0.9912 for 𝜀c = 2,690 ± 421, τc = 2.0 ± 0.54, and Ω = 1,994 ± 118. The dashed line displays the extrapolated size of core genomes Ω.

