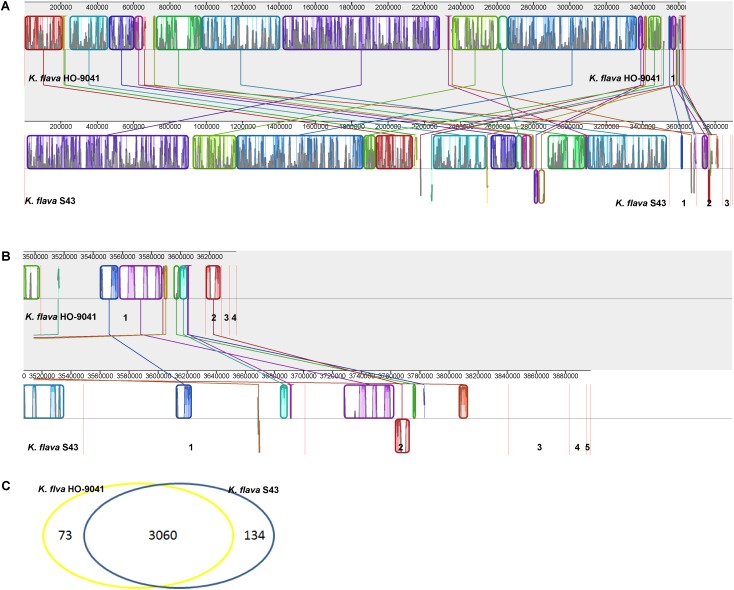
FIGURE 2.
MAUVE alignment of the chromosome and plasmid genome sequences of K. flava S43 and K. flava HO-9041. The contigs were separated by red lines. When boxes had the same color, this indicated syntenic regions. Boxes below the horizontal line indicated inverted regions. Rearrangements were shown by colored lines. Scale was in nucleotides. (A) Chromosome with the boundaries marked by strain name. (B) Plasmid with the figures referring to different contigs. (C) Venn diagram showing the unique and common ORFs in 2 K. flava genomes.

