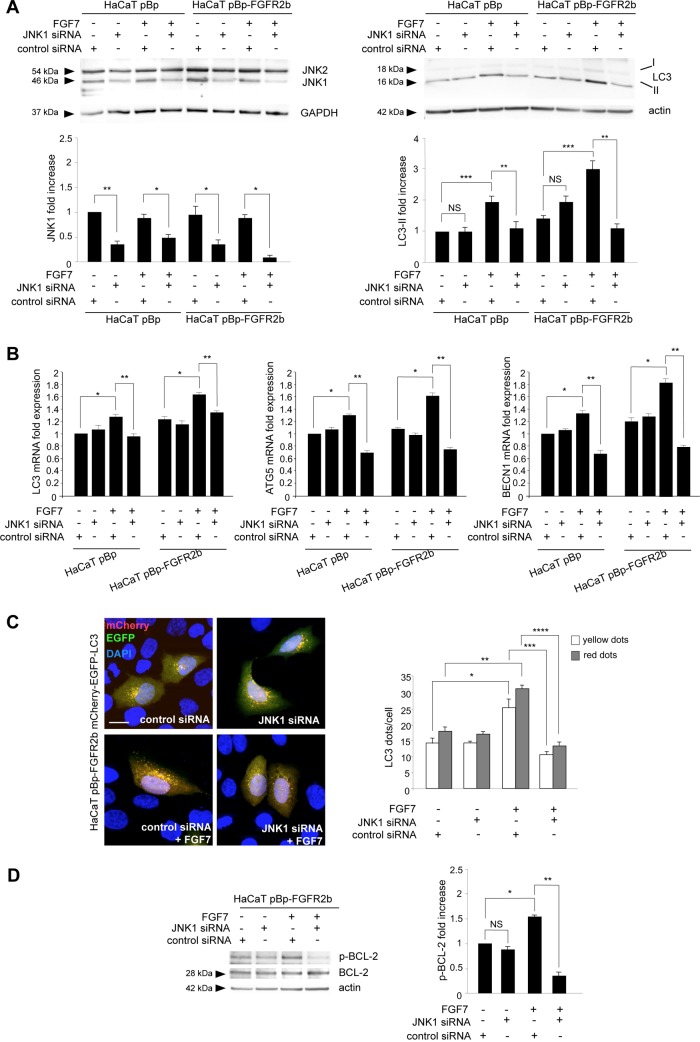
FIG 4.
JNK1 plays a role in both FGFR2b-mediated transcriptional control and posttranslational control of autophagy. (A, B) HaCaT pBp and HaCaT pBp-FGFR2b clones were transiently transfected with JNK1 siRNA or an unrelated siRNA as a control. Cells were then left untreated or stimulated with FGF7 as described in Materials and Methods. (A) Western blot analysis using anti-JNK1/2 antibody shows that JNK1 siRNA induces efficient depletion of JNK1 (left). JNK1 silencing strongly affects the FGF7-induced increase in LC3-II (right). Equal loading was assessed with antiactin and anti-GAPDH antibodies. Densitometric analysis and Student's t test were performed as reported in the legend to Fig. 2. For comparison to the results for the corresponding control siRNA cells: *, P < 0.05; **, P < 0.01; NS, not significant. ***, P < 0.05 versus the results for the corresponding FGF7-unstimulated cells. (B) Real-time RT-PCR analysis shows that the increases in LC3, ATG5, and BECN1 mRNA transcripts induced by FGF7 stimulation are significantly counteracted by JNK1 depletion. Results are expressed as mean values ± SE. Quantitative analysis and Student's t test were performed as as reported in the legend to Fig. 1B. *, P < 0.05 versus the results for the corresponding FGF7-unstimulated cells; **, P < 0.05 versus the results for the corresponding control siRNA cells. (C) HaCaT pBp-FGFR2b cells were cotransfected with JNK1 siRNA or control siRNA and mCherry-EGFP-LC3. Cells were then left untreated or stimulated with FGF7 as described in Materials and Methods. Quantitative fluorescence analysis shows that JNK1 depletion significantly inhibits the increases in both yellow and red dots per cell induced by FGF7 stimulation. Quantitative analysis was performed as described in Materials and Methods, and results are expressed as mean values ± SE. Student's t test was performed as reported in the legend to Fig. 1A. For comparison to the results for the corresponding FGF7-unstimulated cells: *, P < 0.05; **, P < 0.001. For comparison to the results for the corresponding control siRNA cells: ***, P < 0.05; ****, P < 0.01. Bar = 10 μm. (D) HaCaT pBp-FGFR2b clones transfected with JNK1 siRNA or control siRNA were left untreated or stimulated with FGF7 as described in Materials and Methods. Western blot analysis shows that the increase in BCL-2 phosphorylation induced by FGF7 stimulation is significantly repressed by JNK1 depletion. Equal loading was assessed with anti-BCL-2 antibody. Densitometric analysis and Student's t test were performed as reported in the legend to Fig. 2. *, P < 0.05 versus the results for the corresponding FGF7-unstimulated cells. For comparison to the results for the corresponding control siRNA cells: **, P < 0.01; NS, not significant.

