FIG 3.
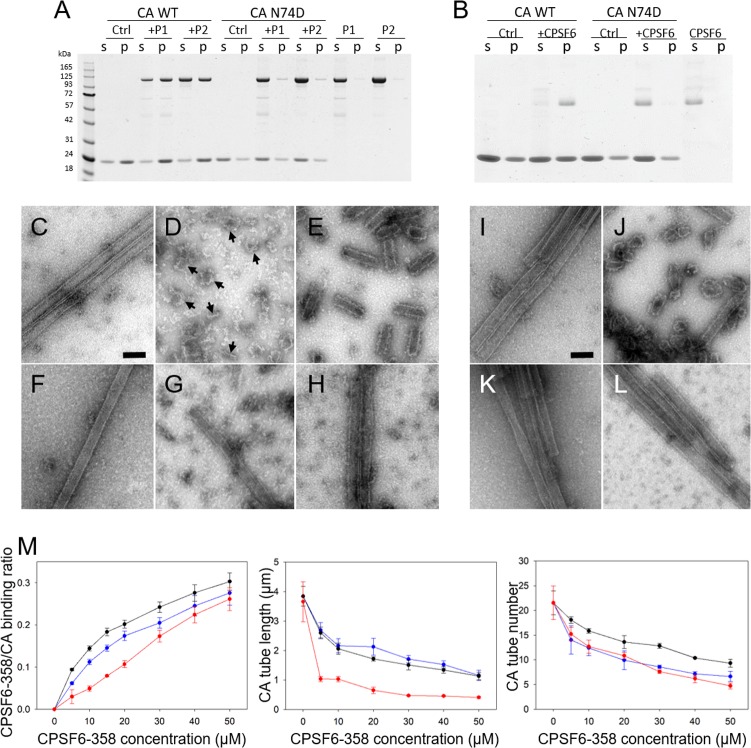
CPSF6-358 binds and disrupts WT CA tubular assemblies. (A) SDS-PAGE of WT and N74D CA assemblies, following incubation with His6-albumin–CPSF6-358, from P1 or P2 and centrifugation. The gel was Coomassie blue stained, with supernatant (s) and pellet (p) samples indicated. (B) SDS-PAGE of WT and N74D CA assemblies following incubation with untagged CPSF6-358 and centrifugation. (C to H) Representative negative-stain EM micrographs of the samples in panel A. (C to E) WT CA tubular assemblies alone (C) or with 30 μM P1 (D) or 30 μM P2 (E) His6-albumin–CPSF6-358. (F to H) CA N74D alone (F) or with 30 μM P1 (G) or 30 μM P2 (H) His6-albumin–CPSF6-358. The arrows indicate the capsid fragments. (I to L) Representative negative-stain EM micrographs of the samples in panel B. Shown are WT CA tubular assemblies alone (I) or with 30 μM CPSF6-358 (J) and CA N74D tubular assemblies alone (K) or with 30 μM CPSF6-358 (L). Scale bars, 100 nm. (M) Dose-dependent effect of CPSF6-358 on CA tubes. Shown is binding of P1 (blue), P2 (black), and CPSF6-358 (red) to assembled WT CA tubes (left). The effects of P1 (blue), P2 (black), and CPSF6-358 (red) binding on the average length of tubes (middle) and on the number of remaining initial tubular assemblies (right) were measured. The error bars indicate the standard deviation of the values.

