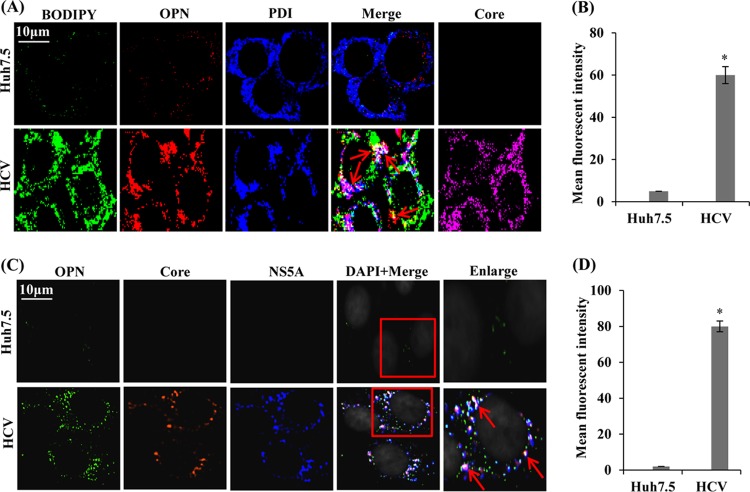
FIG 9.
Colocalization of OPN with LDs and ER. (A) Mock- and HCV-infected cells (day 7) were immunostained using BODIPY dye, anti-OPN, anti-PDI, and anti-core antibodies for 1 h at room temperature, followed by incubation with secondary antibodies for OPN (anti-goat Alexa Fluor 546), PDI (anti-rabbit Alexa Fluor 405), and core (anti-mouse Alexa Fluor 633). BODIPY dye was visualized at 488 nm. Red arrows indicate the colocalization of OPN with LDs and ER in white. HCV core represents HCV infection in cells and is shown in magenta (right panel). (B) The mean fluorescent intensities were analyzed for the colocalization of OPN-LD-ER (white spots) for three different fields with a minimum of 10 cells each with the metamorph pixel intensity calculator. Error bars represent SDs. *, P < 0.05. (C) Colocalization of OPN with NS5A and core. Mock- and HCV-infected cells (day 7) were immunostained with anti-OPN, anti-NS5A, and anti-core antibodies for 1 h at room temperature, followed by incubation with secondary antibodies for OPN (anti-goat Alexa Fluor 488), NS5A (anti-rabbit Alexa Fluor 633), and core (anti-mouse Alexa Fluor 546). Boxed areas were enlarged, and red arrows indicate the colocalization of OPN with NS5A and core in white. Magnification: ×60. (D) The mean fluorescent intensities were analyzed for the colocalization of OPN-core-NS5A (white spots) for three different fields with a minimum of 10 cells each with the metamorph pixel intensity calculator. Error bars represent SDs. *, P < 0.05.

