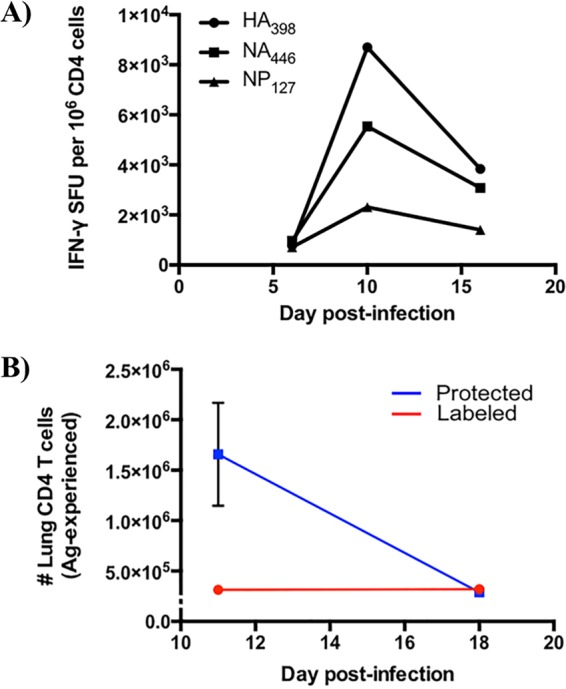
FIG 1.

Kinetics of influenza-specific CD4 T cell responses and localization following A/New Caledonia/20/1999 (H1N1) infection. (A) CD4 T cell epitope-specific responses over time after influenza virus infection. CD4 T cell enzyme-linked immunosorbent spot assays were performed at the indicated time points postinfection, where responses of lung CD4 T cells to three different influenza epitopes (HA398, NA446, NP127; Table 1) were enumerated. SFU stands for spot-forming units, which correspond to the number of epitope-specific cells, represented as frequency per million. Data reflect responses from 5 animals whose tissues were pooled prior to analyses. (B) Antigen-experienced CD4 T cells decline dramatically in lung tissue following influenza A virus infection. CD44+, antigen-experienced cells that were iv labeled (red) and protected (blue) were quantified using flow cytometry 11 and 18 days postinfection. Symbols reflect the means, while the error bars represent the standard errors of the means (±SEM). Data reflect responses from 6 to 9 individual animals.
