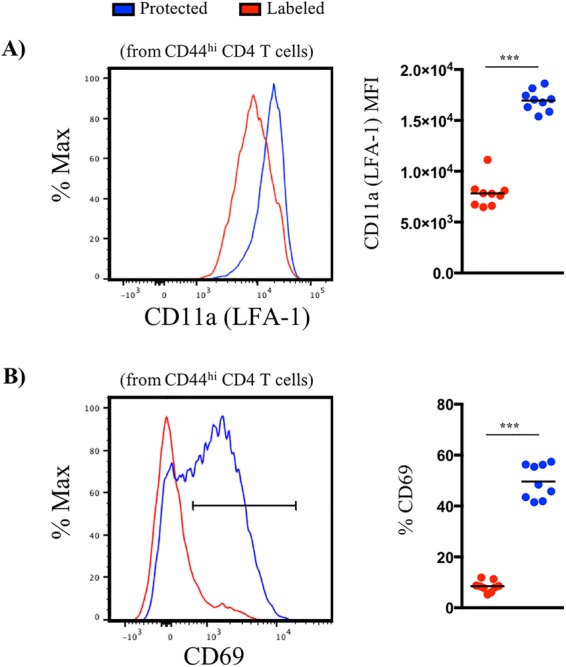
FIG 3.

Protected niches of the lung are enriched in LFA-1 and CD69 expression. (A) Representative histogram plots and quantified median fluorescence intensity (MFI) for LFA-1 (A) and CD69 (B) expression by iv-labeled (red) and -protected (blue) cells. Symbols represent responses from individual animals (n = 9), and horizontal lines indicate the means.
