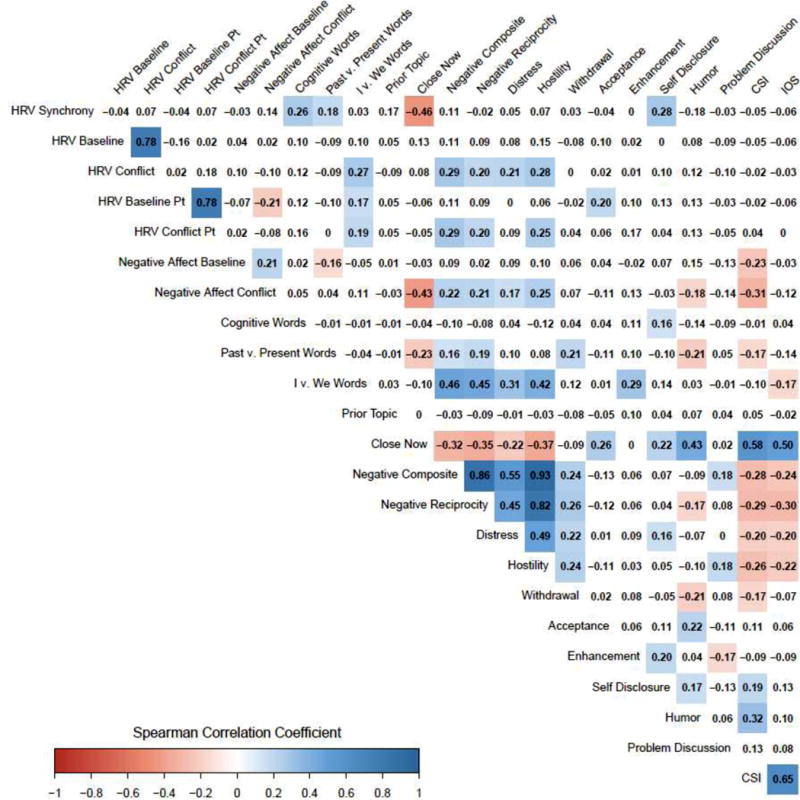
Figure 2.

Heatmap of couple and disagreement characteristics. All correlations are Spearman’s coefficients. Statistically significant (p < .05) positive correlations are colored blue. Significant negative correlations are colored red. Darker saturation reflects larger magnitude. Couples Satisfaction Index (CSI) reflects marital satisfaction; Inclusion of Other in Self (IOS) measures general closeness to the partner.
